

Amidst a backdrop of global economic uncertainty, the European market has shown resilience with mixed returns across major stock indexes, as the pan-European STOXX Europe 600 Index ended slightly lower following ten weeks of gains. This environment highlights the importance of identifying tech stocks that demonstrate strong growth potential and adaptability to changing market conditions, making them valuable considerations for investors exploring high-growth opportunities in Europe's technology sector.
Top 10 High Growth Tech Companies In Europe
| Name | Revenue Growth | Earnings Growth | Growth Rating |
|---|---|---|---|
| Pharma Mar | 24.24% | 40.82% | ★★★★★★ |
| Elicera Therapeutics | 63.53% | 97.24% | ★★★★★★ |
| Bonesupport Holding | 30.48% | 50.17% | ★★★★★★ |
| CD Projekt | 27.71% | 41.31% | ★★★★★★ |
| Yubico | 20.88% | 26.53% | ★★★★★★ |
| Xbrane Biopharma | 73.73% | 139.21% | ★★★★★★ |
| XTPL | 97.45% | 117.95% | ★★★★★★ |
| Elliptic Laboratories | 49.76% | 88.21% | ★★★★★★ |
| Ascelia Pharma | 46.09% | 66.93% | ★★★★★★ |
| Skolon | 29.71% | 91.18% | ★★★★★★ |
Let's dive into some prime choices out of from the screener.
Crayon Group Holding (OB:CRAYN)
Simply Wall St Growth Rating: ★★★★☆☆
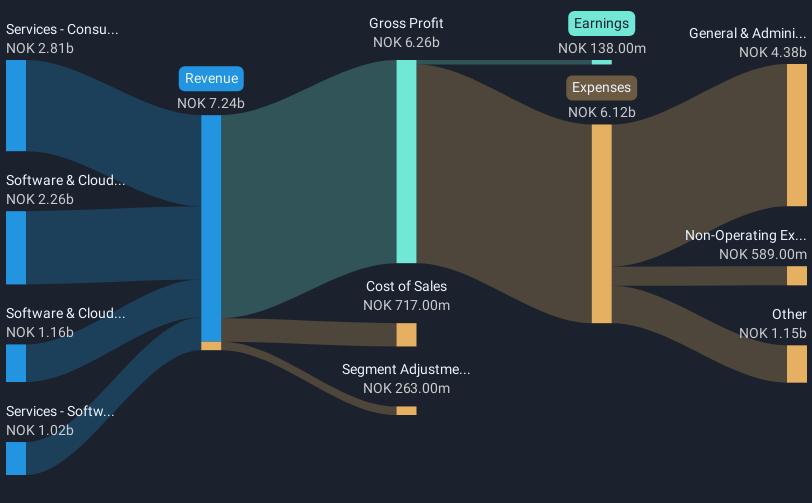
Overview: Crayon Group Holding ASA, along with its subsidiaries, functions as an IT consultancy company with a market capitalization of NOK9.74 billion.
Operations: Crayon Group Holding ASA generates revenue primarily from its IT consultancy services, with significant contributions from Software & Cloud Direct (NOK2.29 billion) and Consulting Services (NOK2.87 billion). The company also derives income from Software & Cloud Economics (NOK1.02 billion) and Software & Cloud Channel (NOK1.18 billion).
Crayon Group Holding ASA has recently demonstrated robust financial health, transitioning from a net loss to profitability within the last year. This turnaround was highlighted in their latest quarterly report where sales rose to NOK 1.84 billion, up from NOK 1.81 billion year-over-year, and net income reached NOK 43 million compared to a previous loss of NOK 78 million. The firm is also poised for significant growth with an expected annual earnings increase of 36.5% over the next three years, outpacing the Norwegian market's forecast of 8.3%. Additionally, Crayon's strategic merger with SoftwareOne promises enhanced scale and market reach, potentially reshaping competitive dynamics in the European tech landscape and fostering accelerated revenue streams projected at an annual rate of 12.2%.
- Dive into the specifics of Crayon Group Holding here with our thorough health report.
Gain insights into Crayon Group Holding's past trends and performance with our Past report.
BioArctic (OM:BIOA B)
Simply Wall St Growth Rating: ★★★★★★
Overview: BioArctic AB (publ) is a Swedish company focused on developing biological drugs for central nervous system disorders, with a market cap of SEK19.36 billion.
Operations: The company generates revenue primarily from its biotechnology segment, amounting to SEK257.35 million.
BioArctic has been making significant strides in the biotechnology sector, particularly with its recent licensing agreement with Bristol Myers Squibb for its innovative PyroGlutamate-amyloid-beta (PyroGlu-Ab) antibody program. This deal not only brought an upfront payment of USD 100 million but also promises up to USD 1.25 billion in milestone payments plus royalties, highlighting the high potential of BioArctic's specialized BrainTransporter™ technology in treating Alzheimer's disease. Despite a challenging financial year with a net loss reported at SEK 177.08 million, the company's strategic partnerships and advanced R&D capabilities are setting the stage for substantial growth, underscored by a projected annual revenue increase of 31.6% and earnings growth forecast at 38.94%.
- Delve into the full analysis health report here for a deeper understanding of BioArctic.
Evaluate BioArctic's historical performance by accessing our past performance report.
Hemnet Group (OM:HEM)
Simply Wall St Growth Rating: ★★★★★☆
Overview: Hemnet Group AB (publ) operates a residential property platform in Sweden with a market cap of approximately SEK32.56 billion.
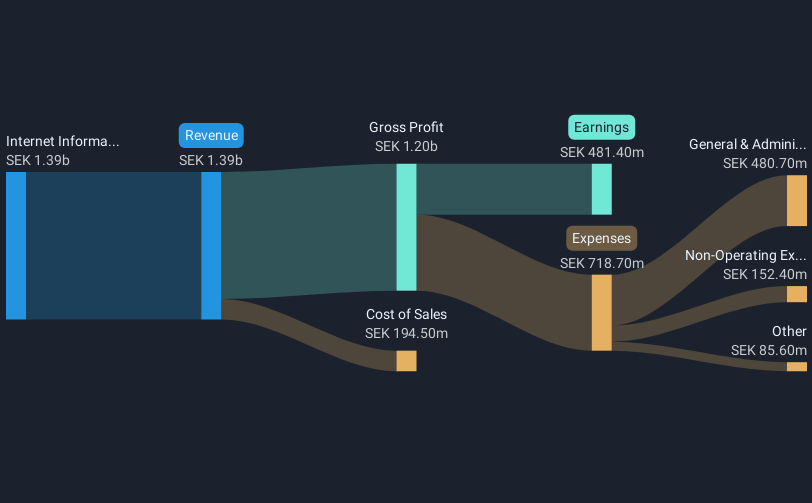
Operations: The company generates revenue primarily from its Internet Information Providers segment, amounting to SEK1.39 billion.
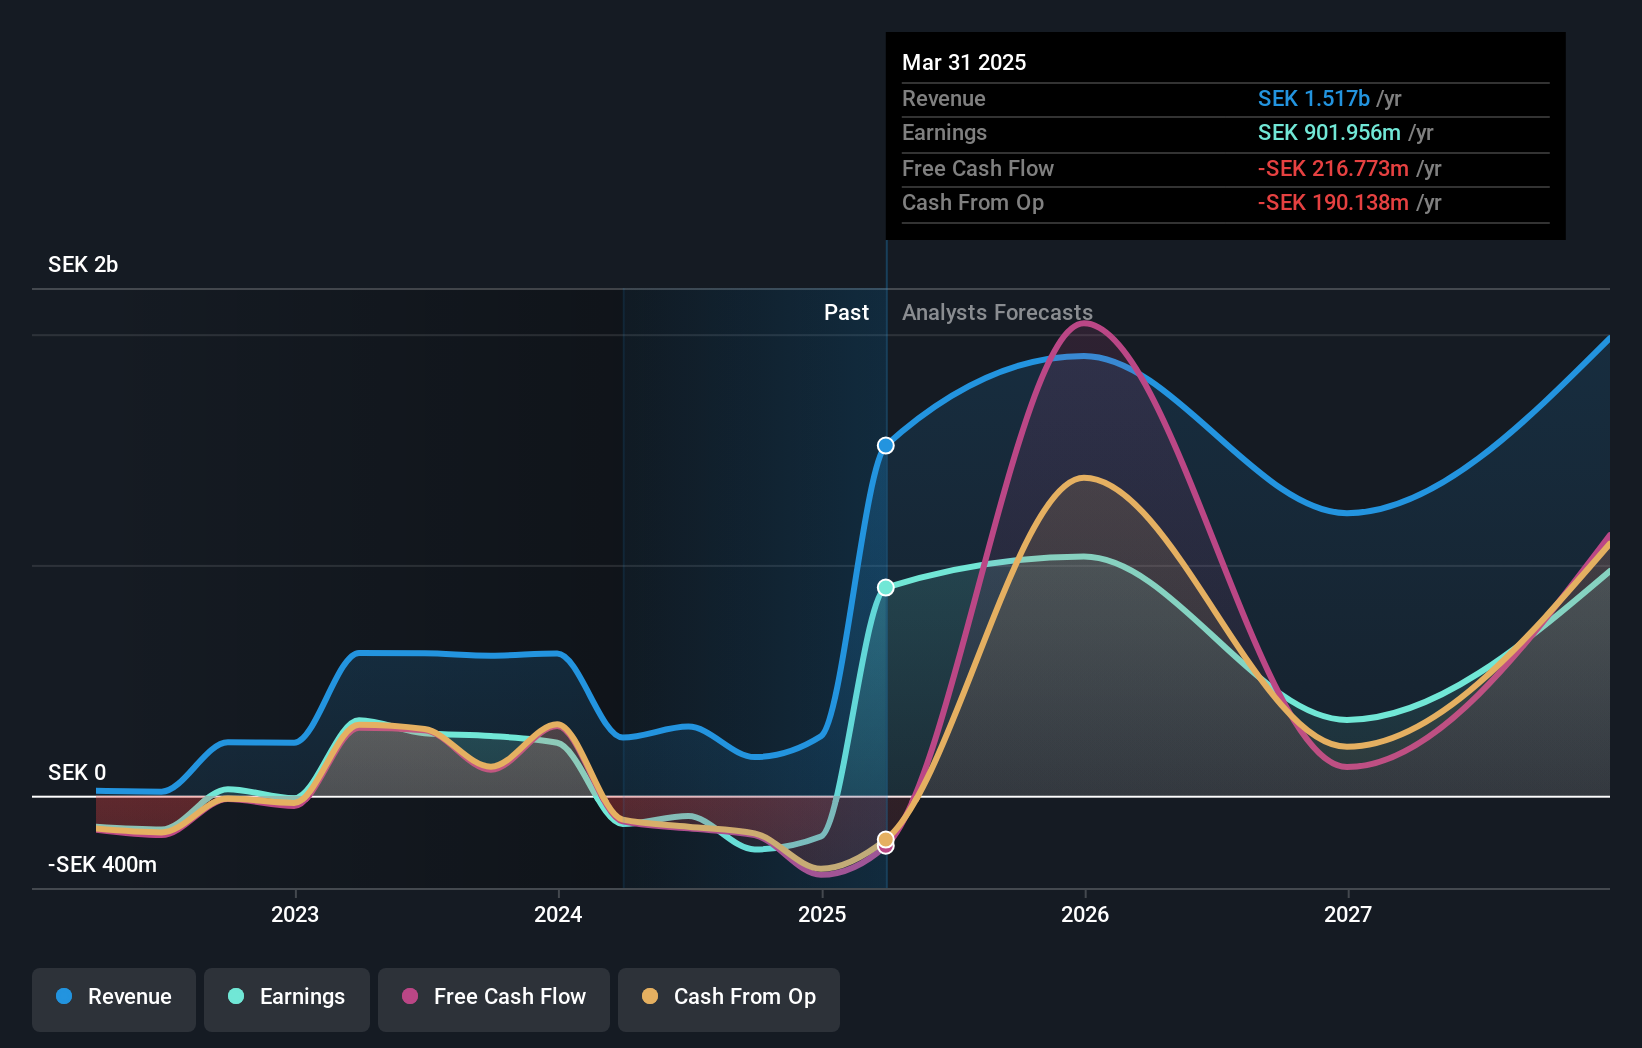
Hemnet Group's recent performance underscores its robust position in the tech sector, with a notable increase in annual revenue to SEK 1.4 billion, up from SEK 1 billion the previous year. This growth is complemented by a substantial rise in net income, reaching SEK 481.4 million, reflecting an earnings surge of 42.1% over the past year—outpacing its industry's growth rate of 18.8%. The company also demonstrated confidence in its trajectory through a share repurchase program, buying back shares worth SEK 264.2 million. These financials are bolstered by Hemnet's strategic advancements and an impressive forecasted return on equity of 80.3%, positioning it well for future expansion amidst competitive market dynamics.
- Click here to discover the nuances of Hemnet Group with our detailed analytical health report.
Examine Hemnet Group's past performance report to understand how it has performed in the past.
Turning Ideas Into Actions
- Explore the 246 names from our European High Growth Tech and AI Stocks screener here.
- Have a stake in these businesses? Integrate your holdings into Simply Wall St's portfolio for notifications and detailed stock reports.
- Join a community of smart investors by using Simply Wall St. It's free and delivers expert-level analysis on worldwide markets.
Interested In Other Possibilities?
- Explore high-performing small cap companies that haven't yet garnered significant analyst attention.
- Fuel your portfolio with companies showing strong growth potential, backed by optimistic outlooks both from analysts and management.
- Find companies with promising cash flow potential yet trading below their fair value.
This article by Simply Wall St is general in nature. We provide commentary based on historical data and analyst forecasts only using an unbiased methodology and our articles are not intended to be financial advice. It does not constitute a recommendation to buy or sell any stock, and does not take account of your objectives, or your financial situation. We aim to bring you long-term focused analysis driven by fundamental data. Note that our analysis may not factor in the latest price-sensitive company announcements or qualitative material. Simply Wall St has no position in any stocks mentioned.
If you're looking to trade Hemnet Group, open an account with the lowest-cost platform trusted by professionals, Interactive Brokers.
With clients in over 200 countries and territories, and access to 160 markets, IBKR lets you trade stocks, options, futures, forex, bonds and funds from a single integrated account.
Enjoy no hidden fees, no account minimums, and FX conversion rates as low as 0.03%, far better than what most brokers offer.
Sponsored ContentValuation is complex, but we're here to simplify it.
Discover if Hemnet Group might be undervalued or overvalued with our detailed analysis, featuring fair value estimates, potential risks, dividends, insider trades, and its financial condition.
Access Free AnalysisHave feedback on this article? Concerned about the content? Get in touch with us directly. Alternatively, email editorial-team@simplywallst.com
About OM:HEM
Outstanding track record with high growth potential.
Market Insights

Community Narratives
