- Norway
- /
- Real Estate
- /
- OB:OLT
Olav Thon Eiendomsselskap's (OB:OLT) earnings growth rate lags the 26% CAGR delivered to shareholders


You can receive the average market return by buying a low-cost index fund. But if you pick the right individual stocks, you could make more than that. Notably, the Olav Thon Eiendomsselskap ASA (OB:OLT) share price has gained 86% in three years, which is better than the average market return. In contrast, the stock is actually down 9.2% in the last year, suggesting a lack of positive momentum.
Although Olav Thon Eiendomsselskap has shed kr710m from its market cap this week, let's take a look at its longer term fundamental trends and see if they've driven returns.
See our latest analysis for Olav Thon Eiendomsselskap
To paraphrase Benjamin Graham: Over the short term the market is a voting machine, but over the long term it's a weighing machine. One flawed but reasonable way to assess how sentiment around a company has changed is to compare the earnings per share (EPS) with the share price.
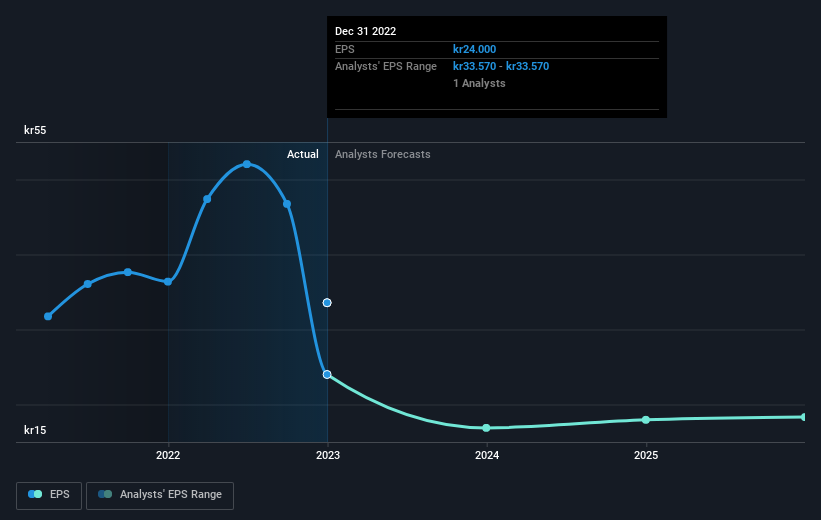
Olav Thon Eiendomsselskap was able to grow its EPS at 11% per year over three years, sending the share price higher. In comparison, the 23% per year gain in the share price outpaces the EPS growth. This indicates that the market is feeling more optimistic on the stock, after the last few years of progress. It is quite common to see investors become enamoured with a business, after a few years of solid progress.
You can see how EPS has changed over time in the image below (click on the chart to see the exact values).
This free interactive report on Olav Thon Eiendomsselskap's earnings, revenue and cash flow is a great place to start, if you want to investigate the stock further.
What About Dividends?
When looking at investment returns, it is important to consider the difference between total shareholder return (TSR) and share price return. The TSR is a return calculation that accounts for the value of cash dividends (assuming that any dividend received was reinvested) and the calculated value of any discounted capital raisings and spin-offs. It's fair to say that the TSR gives a more complete picture for stocks that pay a dividend. We note that for Olav Thon Eiendomsselskap the TSR over the last 3 years was 98%, which is better than the share price return mentioned above. And there's no prize for guessing that the dividend payments largely explain the divergence!
A Different Perspective
While the broader market lost about 3.9% in the twelve months, Olav Thon Eiendomsselskap shareholders did even worse, losing 6.0% (even including dividends). Having said that, it's inevitable that some stocks will be oversold in a falling market. The key is to keep your eyes on the fundamental developments. On the bright side, long term shareholders have made money, with a gain of 6% per year over half a decade. If the fundamental data continues to indicate long term sustainable growth, the current sell-off could be an opportunity worth considering. While it is well worth considering the different impacts that market conditions can have on the share price, there are other factors that are even more important. For instance, we've identified 4 warning signs for Olav Thon Eiendomsselskap (2 are a bit unpleasant) that you should be aware of.
Of course Olav Thon Eiendomsselskap may not be the best stock to buy. So you may wish to see this free collection of growth stocks.
Please note, the market returns quoted in this article reflect the market weighted average returns of stocks that currently trade on Norwegian exchanges.
If you're looking to trade Olav Thon Eiendomsselskap, open an account with the lowest-cost platform trusted by professionals, Interactive Brokers.
With clients in over 200 countries and territories, and access to 160 markets, IBKR lets you trade stocks, options, futures, forex, bonds and funds from a single integrated account.
Enjoy no hidden fees, no account minimums, and FX conversion rates as low as 0.03%, far better than what most brokers offer.
Sponsored ContentNew: AI Stock Screener & Alerts
Our new AI Stock Screener scans the market every day to uncover opportunities.
• Dividend Powerhouses (3%+ Yield)
• Undervalued Small Caps with Insider Buying
• High growth Tech and AI Companies
Or build your own from over 50 metrics.
Have feedback on this article? Concerned about the content? Get in touch with us directly. Alternatively, email editorial-team (at) simplywallst.com.
This article by Simply Wall St is general in nature. We provide commentary based on historical data and analyst forecasts only using an unbiased methodology and our articles are not intended to be financial advice. It does not constitute a recommendation to buy or sell any stock, and does not take account of your objectives, or your financial situation. We aim to bring you long-term focused analysis driven by fundamental data. Note that our analysis may not factor in the latest price-sensitive company announcements or qualitative material. Simply Wall St has no position in any stocks mentioned.
About OB:OLT
Olav Thon Eiendomsselskap
Engages in the property rental business in Norway and Sweden.
Good value second-rate dividend payer.
Market Insights

Community Narratives


