Revenues Working Against Yara International ASA's (OB:YAR) Share Price


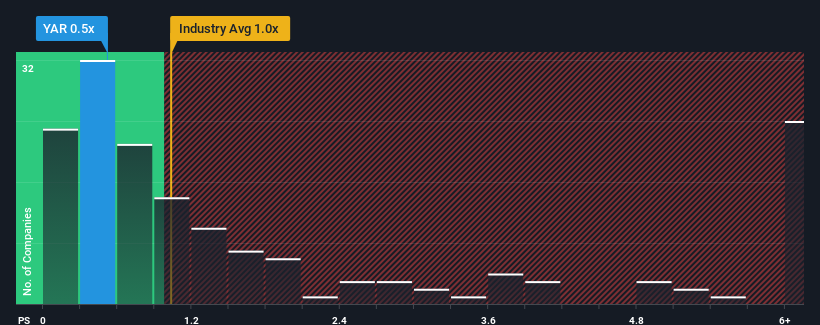
Yara International ASA's (OB:YAR) price-to-sales (or "P/S") ratio of 0.5x might make it look like a strong buy right now compared to the Chemicals industry in Norway, where around half of the companies have P/S ratios above 6.8x and even P/S above 26x are quite common. However, the P/S might be quite low for a reason and it requires further investigation to determine if it's justified.
Check out our latest analysis for Yara International
What Does Yara International's Recent Performance Look Like?
Recent times haven't been great for Yara International as its revenue has been falling quicker than most other companies. It seems that many are expecting the dismal revenue performance to persist, which has repressed the P/S. If you still like the company, you'd want its revenue trajectory to turn around before making any decisions. If not, then existing shareholders will probably struggle to get excited about the future direction of the share price.
If you'd like to see what analysts are forecasting going forward, you should check out our free report on Yara International.How Is Yara International's Revenue Growth Trending?
In order to justify its P/S ratio, Yara International would need to produce anemic growth that's substantially trailing the industry.
Retrospectively, the last year delivered a frustrating 35% decrease to the company's top line. Still, the latest three year period has seen an excellent 33% overall rise in revenue, in spite of its unsatisfying short-term performance. Accordingly, while they would have preferred to keep the run going, shareholders would definitely welcome the medium-term rates of revenue growth.
Looking ahead now, revenue is anticipated to climb by 2.8% each year during the coming three years according to the analysts following the company. That's shaping up to be materially lower than the 79% per annum growth forecast for the broader industry.
With this information, we can see why Yara International is trading at a P/S lower than the industry. Apparently many shareholders weren't comfortable holding on while the company is potentially eyeing a less prosperous future.
What We Can Learn From Yara International's P/S?
We'd say the price-to-sales ratio's power isn't primarily as a valuation instrument but rather to gauge current investor sentiment and future expectations.
We've established that Yara International maintains its low P/S on the weakness of its forecast growth being lower than the wider industry, as expected. Right now shareholders are accepting the low P/S as they concede future revenue probably won't provide any pleasant surprises. The company will need a change of fortune to justify the P/S rising higher in the future.
You should always think about risks. Case in point, we've spotted 3 warning signs for Yara International you should be aware of.
If you're unsure about the strength of Yara International's business, why not explore our interactive list of stocks with solid business fundamentals for some other companies you may have missed.
If you're looking to trade Yara International, open an account with the lowest-cost platform trusted by professionals, Interactive Brokers.
With clients in over 200 countries and territories, and access to 160 markets, IBKR lets you trade stocks, options, futures, forex, bonds and funds from a single integrated account.
Enjoy no hidden fees, no account minimums, and FX conversion rates as low as 0.03%, far better than what most brokers offer.
Sponsored ContentNew: Manage All Your Stock Portfolios in One Place
We've created the ultimate portfolio companion for stock investors, and it's free.
• Connect an unlimited number of Portfolios and see your total in one currency
• Be alerted to new Warning Signs or Risks via email or mobile
• Track the Fair Value of your stocks
Have feedback on this article? Concerned about the content? Get in touch with us directly. Alternatively, email editorial-team (at) simplywallst.com.
This article by Simply Wall St is general in nature. We provide commentary based on historical data and analyst forecasts only using an unbiased methodology and our articles are not intended to be financial advice. It does not constitute a recommendation to buy or sell any stock, and does not take account of your objectives, or your financial situation. We aim to bring you long-term focused analysis driven by fundamental data. Note that our analysis may not factor in the latest price-sensitive company announcements or qualitative material. Simply Wall St has no position in any stocks mentioned.
About OB:YAR
Yara International
Provides crop nutrition and industrial solutions in Norway, European Union, Europe, Africa, Asia, North and Latin America, Australia, and New Zealand.
Good value with reasonable growth potential.

