
Advertisement
Are SalMar ASA's (OB:SALM) Mixed Financials Driving The Negative Sentiment?

It is hard to get excited after looking at SalMar's (OB:SALM) recent performance, when its stock has declined 12% over the past three months. We, however decided to study the company's financials to determine if they have got anything to do with the price decline. Long-term fundamentals are usually what drive market outcomes, so it's worth paying close attention. Specifically, we decided to study SalMar's ROE in this article.
ROE or return on equity is a useful tool to assess how effectively a company can generate returns on the investment it received from its shareholders. In other words, it is a profitability ratio which measures the rate of return on the capital provided by the company's shareholders.
See our latest analysis for SalMar
How Is ROE Calculated?
Return on equity can be calculated by using the formula:
Return on Equity = Net Profit (from continuing operations) ÷ Shareholders' Equity
So, based on the above formula, the ROE for SalMar is:
15% = kr3.1b ÷ kr20b (Based on the trailing twelve months to December 2024).
The 'return' is the yearly profit. Another way to think of that is that for every NOK1 worth of equity, the company was able to earn NOK0.15 in profit.
What Is The Relationship Between ROE And Earnings Growth?
So far, we've learned that ROE is a measure of a company's profitability. Based on how much of its profits the company chooses to reinvest or "retain", we are then able to evaluate a company's future ability to generate profits. Assuming all else is equal, companies that have both a higher return on equity and higher profit retention are usually the ones that have a higher growth rate when compared to companies that don't have the same features.
SalMar's Earnings Growth And 15% ROE
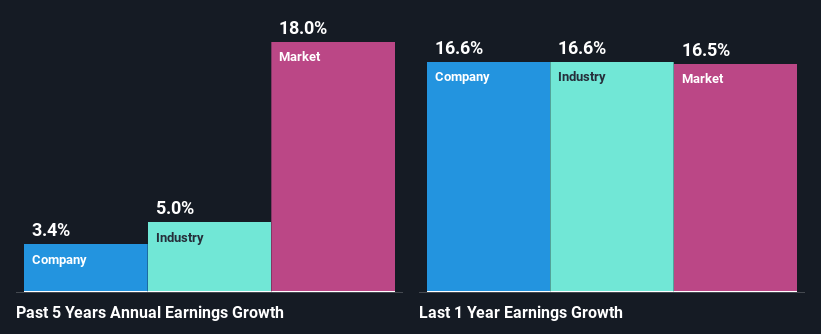
To start with, SalMar's ROE looks acceptable. On comparing with the average industry ROE of 12% the company's ROE looks pretty remarkable. Yet, SalMar has posted measly growth of 3.4% over the past five years. That's a bit unexpected from a company which has such a high rate of return. We reckon that a low growth, when returns are quite high could be the result of certain circumstances like low earnings retention or poor allocation of capital.
As a next step, we compared SalMar's net income growth with the industry and were disappointed to see that the company's growth is lower than the industry average growth of 5.0% in the same period.
The basis for attaching value to a company is, to a great extent, tied to its earnings growth. It’s important for an investor to know whether the market has priced in the company's expected earnings growth (or decline). Doing so will help them establish if the stock's future looks promising or ominous. If you're wondering about SalMar's's valuation, check out this gauge of its price-to-earnings ratio, as compared to its industry.
Is SalMar Making Efficient Use Of Its Profits?
With a high three-year median payout ratio of 98% (or a retention ratio of 2.2%), most of SalMar's profits are being paid to shareholders. This definitely contributes to the low earnings growth seen by the company.
Moreover, SalMar has been paying dividends for at least ten years or more suggesting that management must have perceived that the shareholders prefer dividends over earnings growth. Our latest analyst data shows that the future payout ratio of the company is expected to drop to 75% over the next three years. The fact that the company's ROE is expected to rise to 31% over the same period is explained by the drop in the payout ratio.
Conclusion
On the whole, we feel that the performance shown by SalMar can be open to many interpretations. Despite the high ROE, the company has a disappointing earnings growth number, due to its poor rate of reinvestment into its business. With that said, the latest industry analyst forecasts reveal that the company's earnings are expected to accelerate. To know more about the latest analysts predictions for the company, check out this visualization of analyst forecasts for the company.
New: Manage All Your Stock Portfolios in One Place
We've created the ultimate portfolio companion for stock investors, and it's free.
• Connect an unlimited number of Portfolios and see your total in one currency
• Be alerted to new Warning Signs or Risks via email or mobile
• Track the Fair Value of your stocks
Have feedback on this article? Concerned about the content? Get in touch with us directly. Alternatively, email editorial-team (at) simplywallst.com.
This article by Simply Wall St is general in nature. We provide commentary based on historical data and analyst forecasts only using an unbiased methodology and our articles are not intended to be financial advice. It does not constitute a recommendation to buy or sell any stock, and does not take account of your objectives, or your financial situation. We aim to bring you long-term focused analysis driven by fundamental data. Note that our analysis may not factor in the latest price-sensitive company announcements or qualitative material. Simply Wall St has no position in any stocks mentioned.
About OB:SALM
SalMar
An aquaculture company, produces and sells farmed salmon in Asia, North America, Europe, and internationally.
High growth potential with solid track record.
Similar Companies
Market Insights

Advertisement
Community Narratives
Pinterest will surge as advertising innovations ignite revenue growth
Fair Value US$42.63|26.3% undervalued
BR
Community Contributor
Brambles' Revenue Set to Climb 14% with Profit Margins Following
Fair Value AU$21.90|4.8% overvalued
RO
Community Contributor
Challenging Future for STG as Organic Sales Decline by 8.8%
Fair Value DKK 116.13|26.8% undervalued
KA
Community Contributor