

Today we'll do a simple run through of a valuation method used to estimate the attractiveness of Orkla ASA (OB:ORK) as an investment opportunity by estimating the company's future cash flows and discounting them to their present value. Our analysis will employ the Discounted Cash Flow (DCF) model. Believe it or not, it's not too difficult to follow, as you'll see from our example!
Remember though, that there are many ways to estimate a company's value, and a DCF is just one method. For those who are keen learners of equity analysis, the Simply Wall St analysis model here may be something of interest to you.
View our latest analysis for Orkla
Step by step through the calculation
We are going to use a two-stage DCF model, which, as the name states, takes into account two stages of growth. The first stage is generally a higher growth period which levels off heading towards the terminal value, captured in the second 'steady growth' period. To begin with, we have to get estimates of the next ten years of cash flows. Where possible we use analyst estimates, but when these aren't available we extrapolate the previous free cash flow (FCF) from the last estimate or reported value. We assume companies with shrinking free cash flow will slow their rate of shrinkage, and that companies with growing free cash flow will see their growth rate slow, over this period. We do this to reflect that growth tends to slow more in the early years than it does in later years.
A DCF is all about the idea that a dollar in the future is less valuable than a dollar today, so we need to discount the sum of these future cash flows to arrive at a present value estimate:
10-year free cash flow (FCF) forecast
| 2022 | 2023 | 2024 | 2025 | 2026 | 2027 | 2028 | 2029 | 2030 | 2031 | |
| Levered FCF (NOK, Millions) | kr3.77b | kr4.35b | kr4.74b | kr4.89b | kr5.01b | kr5.11b | kr5.19b | kr5.27b | kr5.34b | kr5.41b |
| Growth Rate Estimate Source | Analyst x2 | Analyst x2 | Analyst x2 | Analyst x1 | Analyst x1 | Est @ 1.92% | Est @ 1.67% | Est @ 1.49% | Est @ 1.36% | Est @ 1.27% |
| Present Value (NOK, Millions) Discounted @ 4.5% | kr3.6k | kr4.0k | kr4.2k | kr4.1k | kr4.0k | kr3.9k | kr3.8k | kr3.7k | kr3.6k | kr3.5k |
("Est" = FCF growth rate estimated by Simply Wall St)
Present Value of 10-year Cash Flow (PVCF) = kr38b
We now need to calculate the Terminal Value, which accounts for all the future cash flows after this ten year period. The Gordon Growth formula is used to calculate Terminal Value at a future annual growth rate equal to the 5-year average of the 10-year government bond yield of 1.1%. We discount the terminal cash flows to today's value at a cost of equity of 4.5%.
Terminal Value (TV)= FCF2031 × (1 + g) ÷ (r – g) = kr5.4b× (1 + 1.1%) ÷ (4.5%– 1.1%) = kr161b
Present Value of Terminal Value (PVTV)= TV / (1 + r)10= kr161b÷ ( 1 + 4.5%)10= kr104b
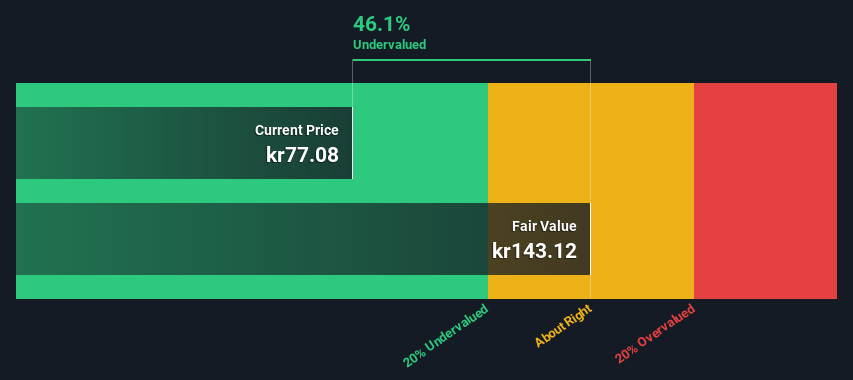
The total value is the sum of cash flows for the next ten years plus the discounted terminal value, which results in the Total Equity Value, which in this case is kr143b. In the final step we divide the equity value by the number of shares outstanding. Compared to the current share price of kr77.1, the company appears quite good value at a 46% discount to where the stock price trades currently. The assumptions in any calculation have a big impact on the valuation, so it is better to view this as a rough estimate, not precise down to the last cent.
Important assumptions
We would point out that the most important inputs to a discounted cash flow are the discount rate and of course the actual cash flows. If you don't agree with these result, have a go at the calculation yourself and play with the assumptions. The DCF also does not consider the possible cyclicality of an industry, or a company's future capital requirements, so it does not give a full picture of a company's potential performance. Given that we are looking at Orkla as potential shareholders, the cost of equity is used as the discount rate, rather than the cost of capital (or weighted average cost of capital, WACC) which accounts for debt. In this calculation we've used 4.5%, which is based on a levered beta of 0.800. Beta is a measure of a stock's volatility, compared to the market as a whole. We get our beta from the industry average beta of globally comparable companies, with an imposed limit between 0.8 and 2.0, which is a reasonable range for a stable business.
Looking Ahead:
Valuation is only one side of the coin in terms of building your investment thesis, and it ideally won't be the sole piece of analysis you scrutinize for a company. It's not possible to obtain a foolproof valuation with a DCF model. Instead the best use for a DCF model is to test certain assumptions and theories to see if they would lead to the company being undervalued or overvalued. If a company grows at a different rate, or if its cost of equity or risk free rate changes sharply, the output can look very different. Can we work out why the company is trading at a discount to intrinsic value? For Orkla, we've compiled three essential aspects you should further research:
- Financial Health: Does ORK have a healthy balance sheet? Take a look at our free balance sheet analysis with six simple checks on key factors like leverage and risk.
- Future Earnings: How does ORK's growth rate compare to its peers and the wider market? Dig deeper into the analyst consensus number for the upcoming years by interacting with our free analyst growth expectation chart.
- Other High Quality Alternatives: Do you like a good all-rounder? Explore our interactive list of high quality stocks to get an idea of what else is out there you may be missing!
PS. Simply Wall St updates its DCF calculation for every Norwegian stock every day, so if you want to find the intrinsic value of any other stock just search here.
New: AI Stock Screener & Alerts
Our new AI Stock Screener scans the market every day to uncover opportunities.
• Dividend Powerhouses (3%+ Yield)
• Undervalued Small Caps with Insider Buying
• High growth Tech and AI Companies
Or build your own from over 50 metrics.
Have feedback on this article? Concerned about the content? Get in touch with us directly. Alternatively, email editorial-team (at) simplywallst.com.
This article by Simply Wall St is general in nature. We provide commentary based on historical data and analyst forecasts only using an unbiased methodology and our articles are not intended to be financial advice. It does not constitute a recommendation to buy or sell any stock, and does not take account of your objectives, or your financial situation. We aim to bring you long-term focused analysis driven by fundamental data. Note that our analysis may not factor in the latest price-sensitive company announcements or qualitative material. Simply Wall St has no position in any stocks mentioned.
About OB:ORK
Orkla
Engages in branded consumer goods, and industrial and financial investment businesses.
Excellent balance sheet average dividend payer.
