
Advertisement
- Norway
- /
- Energy Services
- /
- OB:TGS
TGS ASA's (OB:TGS) Share Price Is Still Matching Investor Opinion Despite 25% Slump

Unfortunately for some shareholders, the TGS ASA (OB:TGS) share price has dived 25% in the last thirty days, prolonging recent pain. Instead of being rewarded, shareholders who have already held through the last twelve months are now sitting on a 44% share price drop.
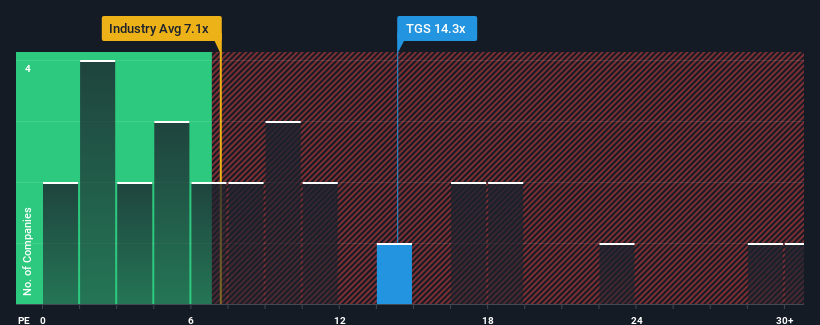
Although its price has dipped substantially, TGS may still be sending bearish signals at the moment with its price-to-earnings (or "P/E") ratio of 14.3x, since almost half of all companies in Norway have P/E ratios under 11x and even P/E's lower than 6x are not unusual. Nonetheless, we'd need to dig a little deeper to determine if there is a rational basis for the elevated P/E.
With earnings growth that's superior to most other companies of late, TGS has been doing relatively well. It seems that many are expecting the strong earnings performance to persist, which has raised the P/E. You'd really hope so, otherwise you're paying a pretty hefty price for no particular reason.
View our latest analysis for TGS
Is There Enough Growth For TGS?
TGS' P/E ratio would be typical for a company that's expected to deliver solid growth, and importantly, perform better than the market.
Taking a look back first, we see that the company grew earnings per share by an impressive 236% last year. Although, its longer-term performance hasn't been as strong with three-year EPS growth being relatively non-existent overall. Accordingly, shareholders probably wouldn't have been overly satisfied with the unstable medium-term growth rates.
Shifting to the future, estimates from the five analysts covering the company suggest earnings should grow by 24% per annum over the next three years. That's shaping up to be materially higher than the 18% per year growth forecast for the broader market.
With this information, we can see why TGS is trading at such a high P/E compared to the market. It seems most investors are expecting this strong future growth and are willing to pay more for the stock.
What We Can Learn From TGS' P/E?
TGS' P/E hasn't come down all the way after its stock plunged. We'd say the price-to-earnings ratio's power isn't primarily as a valuation instrument but rather to gauge current investor sentiment and future expectations.
As we suspected, our examination of TGS' analyst forecasts revealed that its superior earnings outlook is contributing to its high P/E. Right now shareholders are comfortable with the P/E as they are quite confident future earnings aren't under threat. It's hard to see the share price falling strongly in the near future under these circumstances.
And what about other risks? Every company has them, and we've spotted 3 warning signs for TGS (of which 1 is potentially serious!) you should know about.
You might be able to find a better investment than TGS. If you want a selection of possible candidates, check out this free list of interesting companies that trade on a low P/E (but have proven they can grow earnings).
Valuation is complex, but we're here to simplify it.
Discover if TGS might be undervalued or overvalued with our detailed analysis, featuring fair value estimates, potential risks, dividends, insider trades, and its financial condition.
Access Free AnalysisHave feedback on this article? Concerned about the content? Get in touch with us directly. Alternatively, email editorial-team (at) simplywallst.com.
This article by Simply Wall St is general in nature. We provide commentary based on historical data and analyst forecasts only using an unbiased methodology and our articles are not intended to be financial advice. It does not constitute a recommendation to buy or sell any stock, and does not take account of your objectives, or your financial situation. We aim to bring you long-term focused analysis driven by fundamental data. Note that our analysis may not factor in the latest price-sensitive company announcements or qualitative material. Simply Wall St has no position in any stocks mentioned.
About OB:TGS
TGS
Provides geoscience data services to the oil and gas industry in Norway and internationally.
Proven track record with mediocre balance sheet.
Similar Companies
Market Insights

Advertisement
Community Narratives
Pinterest will surge as advertising innovations ignite revenue growth
Fair Value US$42.63|26.3% undervalued
BR
Community Contributor
Brambles' Revenue Set to Climb 14% with Profit Margins Following
Fair Value AU$21.90|4.9% overvalued
RO
Community Contributor
Challenging Future for STG as Organic Sales Decline by 8.8%
Fair Value DKK 116.13|26.8% undervalued
KA
Community Contributor