Advertisement
- Norway
- /
- Energy Services
- /
- OB:TGS
Is Now the Right Time to Revisit TGS After Recent 7% Share Price Jump?

Simply Wall St
Reviewed by Bailey Pemberton
So, you are looking at TGS stock, wondering if now is finally the right time to take a fresh look. After a rough patch earlier this year, TGS has bounced back in the past week, with shares up 7.1%. That’s an eye-catching jump in a market that has been nervous, even if the 30-day gain of 3.7% suggests there is still some hesitation among investors. Longer term, it is clear that TGS has had its ups and downs. The stock is down 32.0% year-to-date, and 16.9% lower than where it was a year ago. However, a closer look shows a positive total return of 8.9% over the past five years. That kind of track record has left many investors asking: is TGS just out of favor, or genuinely undervalued?
To help answer that, many investors turn to valuation checks. These quick six-point scorecards weigh factors like price-to-earnings, price-to-book, and other classic metrics. For TGS, that tally is a 2 out of 6, signaling that the company is undervalued on a couple of these measures but not across the board.
Of course, scoring valuation is a great starting point, but which methods really matter in this market? Let’s break down each approach and set the stage for an even sharper way to judge whether TGS could be a smart buy.
TGS scores just 2/6 on our valuation checks. See what other red flags we found in the full valuation breakdown.
Approach 1: TGS Discounted Cash Flow (DCF) Analysis
The Discounted Cash Flow (DCF) model estimates a company’s intrinsic worth by projecting its future free cash flows and discounting them back to today’s value. This approach helps investors understand what the business should be worth, based on how much cash it can generate, rather than just current performance or market sentiment.
For TGS, the latest reported Free Cash Flow (FCF) stands at $202.6 million. Analyst estimates suggest moderate yearly growth ahead, with FCF projected to reach $209.3 million by the end of 2027. Further out, extrapolated figures see FCF rising to around $262.9 million by 2035. These forecasts, which extend beyond direct analyst coverage, provide a sense of the company's long-term earning power.
Based on these cash flow projections, the DCF method computes an intrinsic share value of NOK 211.39. Compared to TGS’s recent share price, this represents a discount of approximately 62.2%. In other words, the DCF model signals that the stock is trading well below what its future cash generation appears to justify.
Result: UNDERVALUED
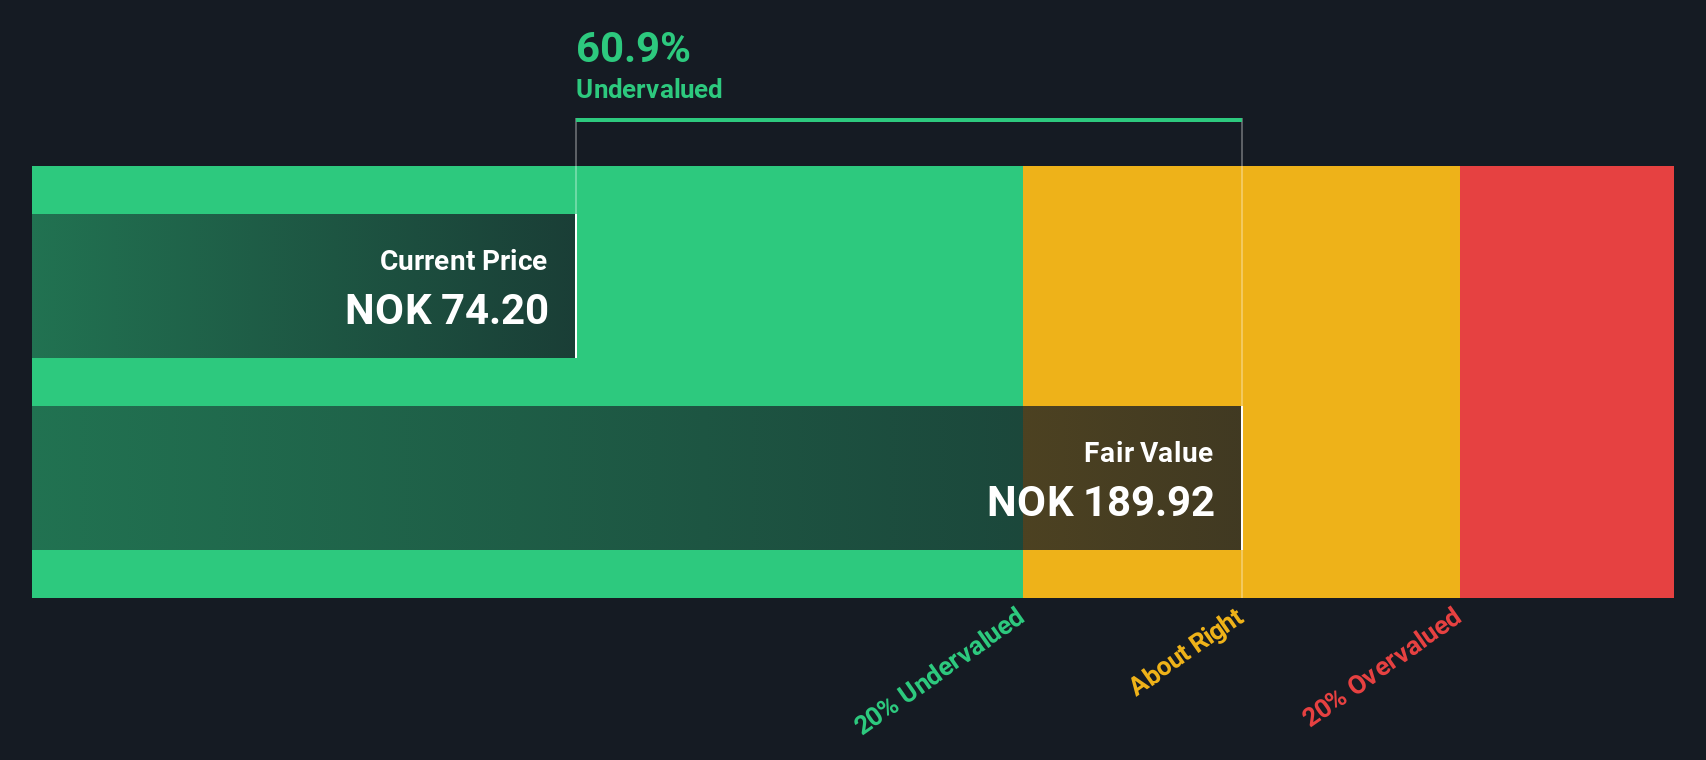
Our Discounted Cash Flow (DCF) analysis suggests TGS is undervalued by 62.2%. Track this in your watchlist or portfolio, or discover more undervalued stocks.
Approach 2: TGS Price vs Earnings
The Price-to-Earnings (PE) ratio is one of the most widely used measures for valuing profitable companies. It shows how much investors are willing to pay today for a unit of current or future earnings, making it especially relevant for established companies like TGS that generate consistent profits.
A company’s fair PE ratio is influenced by growth expectations and risk, among other factors. Higher expected earnings growth, lower risk, or superior profitability can justify a higher PE. In contrast, slower growth and increased uncertainty typically lead to a lower ratio being considered fair.
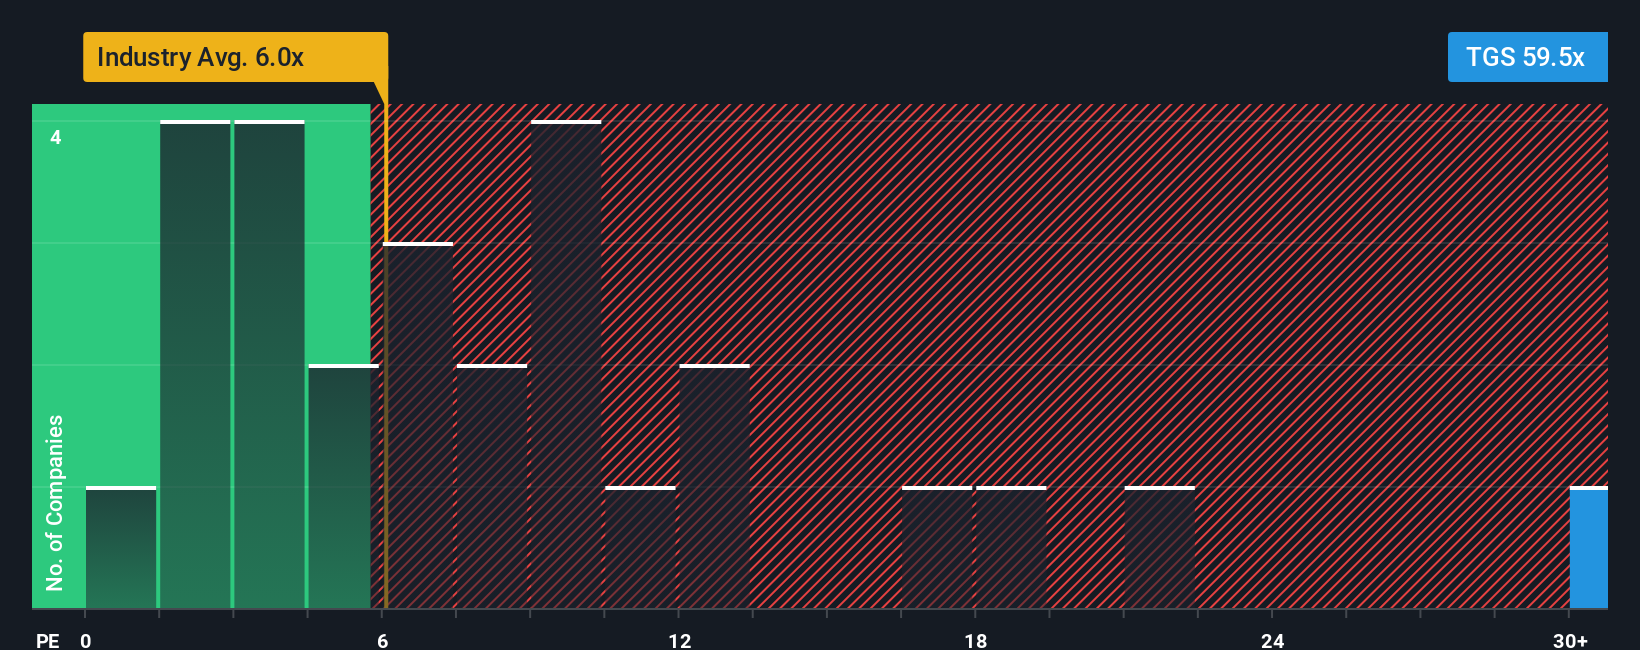
At present, TGS trades on a PE ratio of 62.38x. This is considerably higher than both the Energy Services industry average of 6.53x and the peer group average of 6.64x. On the surface, this raises red flags about overvaluation since the stock is priced at a much greater multiple than its sector peers.
However, Simply Wall St’s proprietary “Fair Ratio” offers deeper insight. Unlike a simple industry comparison, the Fair Ratio factors in TGS’s unique blend of risk, growth rate, profit margin, industry positioning, and market capitalization. For TGS, this Fair Ratio is 15.56x, significantly below its current PE.
Comparing TGS’s actual PE with its Fair Ratio suggests the stock is trading well above what its fundamentals would justify. The premium is too large to be explained solely by the company’s attributes, indicating potential overvaluation by this measure.
Result: OVERVALUED
PE ratios tell one story, but what if the real opportunity lies elsewhere? Discover companies where insiders are betting big on explosive growth.
Upgrade Your Decision Making: Choose your TGS Narrative
Earlier, we mentioned that there's an even better way to make investment decisions, so let's introduce you to Narratives. A Narrative is simply your story behind TGS, combining your perspectives on the company’s opportunities and risks with your own forecasts for growth, profitability, and fair value. With Narratives, you connect what you believe about the business to tangible financial outcomes by linking the company’s story, a forecast, and a fair value so you can clearly decide if the share price matches your expectations.
This tool is available on Simply Wall St’s Community page, where millions of investors quickly create, share, and update Narratives with only a few clicks. Narratives make it easy to track your assumptions and see in real time when news or earnings reports change the numbers behind your story. By comparing the Narrative fair value to the current Price, investors can identify if TGS is trading at an attractive discount or starting to look expensive, supporting more informed decisions.
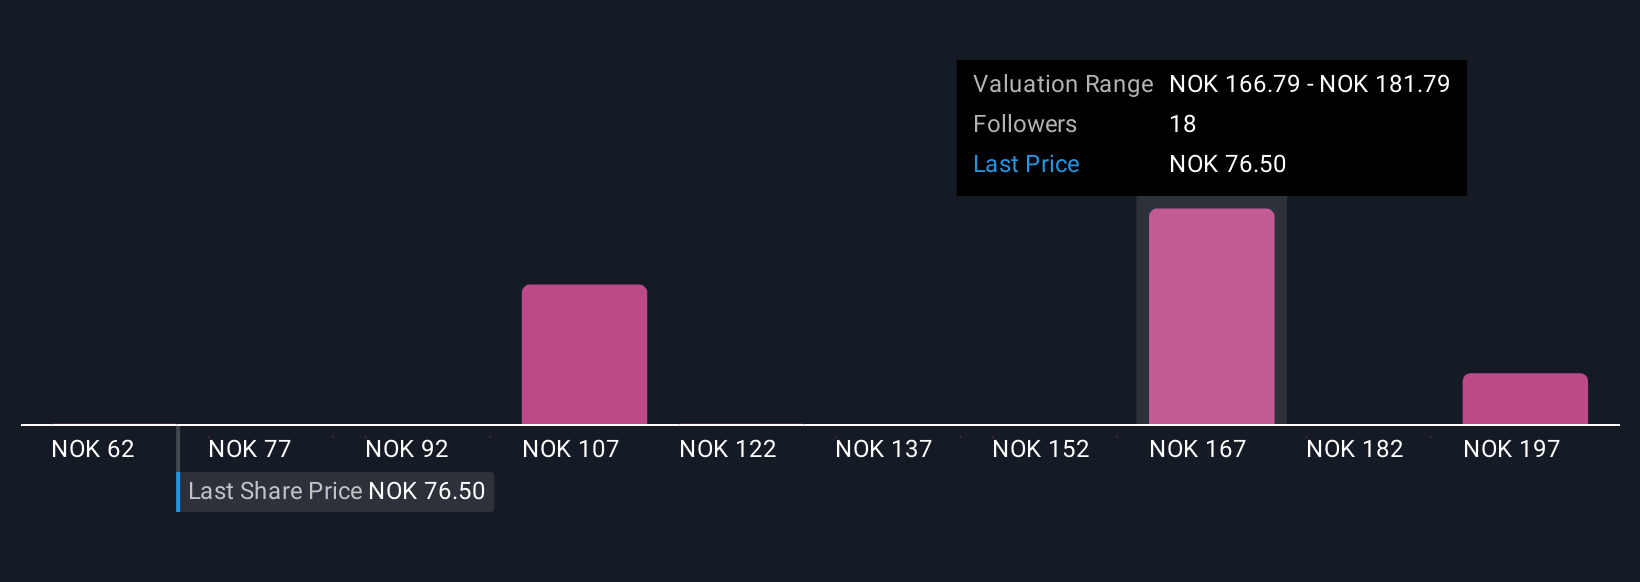
For example, one investor who sees maximum growth potential from recent mergers and clean energy expansion projected a fair value of NOK 180.0 for TGS, while another, more conservative, values it at just NOK 120.1, showing how Narratives reflect your unique market view.
Do you think there's more to the story for TGS? Create your own Narrative to let the Community know!
This article by Simply Wall St is general in nature. We provide commentary based on historical data and analyst forecasts only using an unbiased methodology and our articles are not intended to be financial advice. It does not constitute a recommendation to buy or sell any stock, and does not take account of your objectives, or your financial situation. We aim to bring you long-term focused analysis driven by fundamental data. Note that our analysis may not factor in the latest price-sensitive company announcements or qualitative material. Simply Wall St has no position in any stocks mentioned.
Valuation is complex, but we're here to simplify it.
Discover if TGS might be undervalued or overvalued with our detailed analysis, featuring fair value estimates, potential risks, dividends, insider trades, and its financial condition.
Access Free AnalysisHave feedback on this article? Concerned about the content? Get in touch with us directly. Alternatively, email editorial-team@simplywallst.com
About OB:TGS
TGS
Provides geoscience data services to the oil and gas industry in Norway and internationally.
Moderate growth potential with mediocre balance sheet.
Similar Companies
Market Insights

Advertisement
Community Narratives
A formidable player in AI and enterprise computing.
Fair Value US$210.00|12.2% overvalued
CO
Community Contributor
IREN's Bold Moves in Sustainable Bitcoin Mining & AI Data Centers
Fair Value US$72.52|17.1% undervalued
BL
Community Contributor
Cooling the Champions: The Aussie Tech Behind F1's Victories
Fair Value AU$12.40|38.7% undervalued
TR
Community Contributor