
Advertisement

Legendary fund manager Li Lu (who Charlie Munger backed) once said, 'The biggest investment risk is not the volatility of prices, but whether you will suffer a permanent loss of capital.' So it seems the smart money knows that debt - which is usually involved in bankruptcies - is a very important factor, when you assess how risky a company is. We can see that Reach Subsea ASA (OB:REACH) does use debt in its business. But the more important question is: how much risk is that debt creating?
When Is Debt Dangerous?
Debt and other liabilities become risky for a business when it cannot easily fulfill those obligations, either with free cash flow or by raising capital at an attractive price. If things get really bad, the lenders can take control of the business. While that is not too common, we often do see indebted companies permanently diluting shareholders because lenders force them to raise capital at a distressed price. Having said that, the most common situation is where a company manages its debt reasonably well - and to its own advantage. When we examine debt levels, we first consider both cash and debt levels, together.
See our latest analysis for Reach Subsea
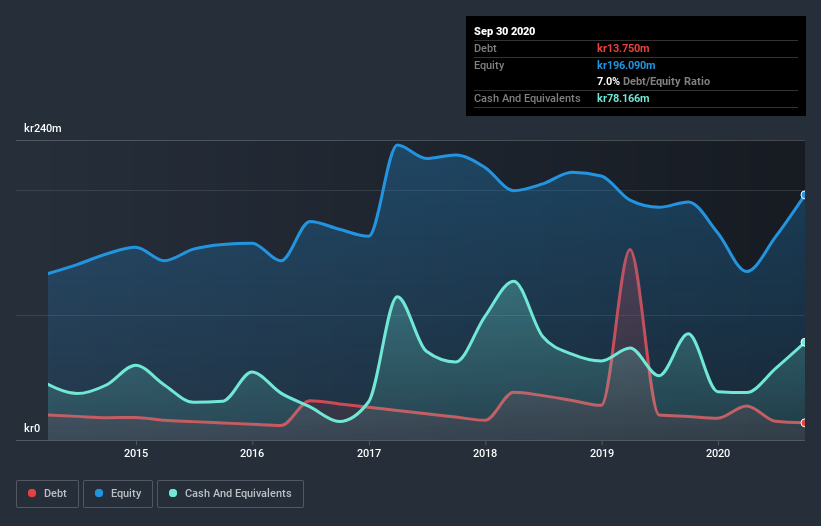
What Is Reach Subsea's Debt?
You can click the graphic below for the historical numbers, but it shows that Reach Subsea had kr13.8m of debt in September 2020, down from kr18.8m, one year before. But it also has kr78.2m in cash to offset that, meaning it has kr64.4m net cash.
A Look At Reach Subsea's Liabilities
According to the last reported balance sheet, Reach Subsea had liabilities of kr175.8m due within 12 months, and liabilities of kr15.8m due beyond 12 months. Offsetting this, it had kr78.2m in cash and kr165.3m in receivables that were due within 12 months. So it actually has kr51.8m more liquid assets than total liabilities.
This short term liquidity is a sign that Reach Subsea could probably pay off its debt with ease, as its balance sheet is far from stretched. Succinctly put, Reach Subsea boasts net cash, so it's fair to say it does not have a heavy debt load!
Notably, Reach Subsea's EBIT launched higher than Elon Musk, gaining a whopping 124% on last year. The balance sheet is clearly the area to focus on when you are analysing debt. But it is Reach Subsea's earnings that will influence how the balance sheet holds up in the future. So if you're keen to discover more about its earnings, it might be worth checking out this graph of its long term earnings trend.
Finally, while the tax-man may adore accounting profits, lenders only accept cold hard cash. Reach Subsea may have net cash on the balance sheet, but it is still interesting to look at how well the business converts its earnings before interest and tax (EBIT) to free cash flow, because that will influence both its need for, and its capacity to manage debt. Happily for any shareholders, Reach Subsea actually produced more free cash flow than EBIT over the last three years. That sort of strong cash generation warms our hearts like a puppy in a bumblebee suit.
Summing up
While it is always sensible to investigate a company's debt, in this case Reach Subsea has kr64.4m in net cash and a decent-looking balance sheet. The cherry on top was that in converted 1,156% of that EBIT to free cash flow, bringing in kr192m. So is Reach Subsea's debt a risk? It doesn't seem so to us. The balance sheet is clearly the area to focus on when you are analysing debt. But ultimately, every company can contain risks that exist outside of the balance sheet. We've identified 3 warning signs with Reach Subsea , and understanding them should be part of your investment process.
If you're interested in investing in businesses that can grow profits without the burden of debt, then check out this free list of growing businesses that have net cash on the balance sheet.
If you decide to trade Reach Subsea, use the lowest-cost* platform that is rated #1 Overall by Barron’s, Interactive Brokers. Trade stocks, options, futures, forex, bonds and funds on 135 markets, all from a single integrated account. Promoted
New: AI Stock Screener & Alerts
Our new AI Stock Screener scans the market every day to uncover opportunities.
• Dividend Powerhouses (3%+ Yield)
• Undervalued Small Caps with Insider Buying
• High growth Tech and AI Companies
Or build your own from over 50 metrics.
This article by Simply Wall St is general in nature. It does not constitute a recommendation to buy or sell any stock, and does not take account of your objectives, or your financial situation. We aim to bring you long-term focused analysis driven by fundamental data. Note that our analysis may not factor in the latest price-sensitive company announcements or qualitative material. Simply Wall St has no position in any stocks mentioned.
*Interactive Brokers Rated Lowest Cost Broker by StockBrokers.com Annual Online Review 2020
Have feedback on this article? Concerned about the content? Get in touch with us directly. Alternatively, email editorial-team (at) simplywallst.com.
About OB:REACH
High growth potential with excellent balance sheet.
Similar Companies
Market Insights


Advertisement
Community Narratives
Nike's Direct-to-Consumer Focus Will Drive Future Growth
Fair Value US$87.90|22.7% undervalued
UN
Community Contributor
Novo Nordisk will dominate GLP-1 market with Ozempic and Wegovy growth
Fair Value US$89.59|14.2% undervalued
BE
Community Contributor
Rheinmetall could get 20-25% of EU-NATO 3%-GDP defence spending
Fair Value €7.57k|82.8% undervalued
NO
Community Contributor