
Advertisement
- Norway
- /
- Oil and Gas
- /
- OB:PEN
Panoro Energy (OB:PEN) stock performs better than its underlying earnings growth over last five years

While Panoro Energy ASA (OB:PEN) shareholders are probably generally happy, the stock hasn't had particularly good run recently, with the share price falling 17% in the last quarter. But the silver lining is the stock is up over five years. Unfortunately its return of 38% is below the market return of 65%.
On the back of a solid 7-day performance, let's check what role the company's fundamentals have played in driving long term shareholder returns.
View our latest analysis for Panoro Energy
While the efficient markets hypothesis continues to be taught by some, it has been proven that markets are over-reactive dynamic systems, and investors are not always rational. One flawed but reasonable way to assess how sentiment around a company has changed is to compare the earnings per share (EPS) with the share price.
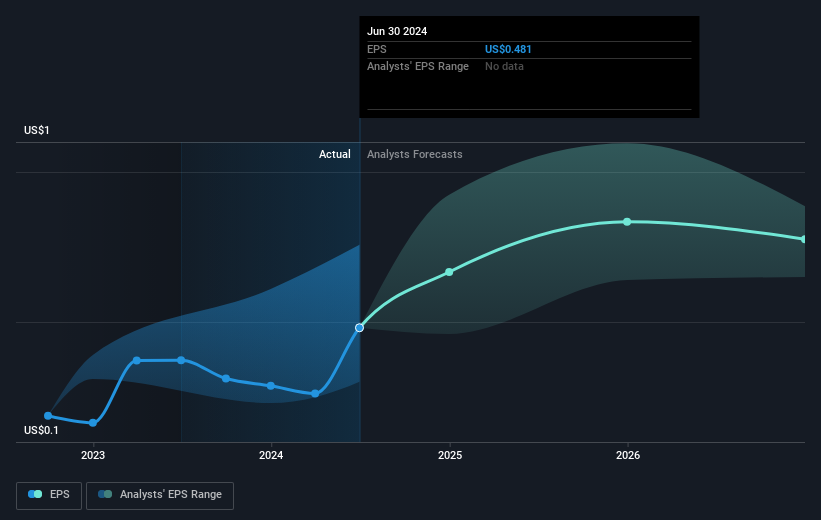
Over half a decade, Panoro Energy managed to grow its earnings per share at 46% a year. The EPS growth is more impressive than the yearly share price gain of 7% over the same period. So it seems the market isn't so enthusiastic about the stock these days. The reasonably low P/E ratio of 5.47 also suggests market apprehension.
You can see how EPS has changed over time in the image below (click on the chart to see the exact values).
We like that insiders have been buying shares in the last twelve months. Having said that, most people consider earnings and revenue growth trends to be a more meaningful guide to the business. This free interactive report on Panoro Energy's earnings, revenue and cash flow is a great place to start, if you want to investigate the stock further.
What About Dividends?
As well as measuring the share price return, investors should also consider the total shareholder return (TSR). Whereas the share price return only reflects the change in the share price, the TSR includes the value of dividends (assuming they were reinvested) and the benefit of any discounted capital raising or spin-off. It's fair to say that the TSR gives a more complete picture for stocks that pay a dividend. As it happens, Panoro Energy's TSR for the last 5 years was 55%, which exceeds the share price return mentioned earlier. And there's no prize for guessing that the dividend payments largely explain the divergence!
A Different Perspective
Panoro Energy provided a TSR of 4.5% over the last twelve months. But that return falls short of the market. It's probably a good sign that the company has an even better long term track record, having provided shareholders with an annual TSR of 9% over five years. Maybe the share price is just taking a breather while the business executes on its growth strategy. It's always interesting to track share price performance over the longer term. But to understand Panoro Energy better, we need to consider many other factors. For example, we've discovered 1 warning sign for Panoro Energy that you should be aware of before investing here.
Panoro Energy is not the only stock insiders are buying. So take a peek at this free list of small cap companies at attractive valuations which insiders have been buying.
Please note, the market returns quoted in this article reflect the market weighted average returns of stocks that currently trade on Norwegian exchanges.
New: Manage All Your Stock Portfolios in One Place
We've created the ultimate portfolio companion for stock investors, and it's free.
• Connect an unlimited number of Portfolios and see your total in one currency
• Be alerted to new Warning Signs or Risks via email or mobile
• Track the Fair Value of your stocks
Have feedback on this article? Concerned about the content? Get in touch with us directly. Alternatively, email editorial-team (at) simplywallst.com.
This article by Simply Wall St is general in nature. We provide commentary based on historical data and analyst forecasts only using an unbiased methodology and our articles are not intended to be financial advice. It does not constitute a recommendation to buy or sell any stock, and does not take account of your objectives, or your financial situation. We aim to bring you long-term focused analysis driven by fundamental data. Note that our analysis may not factor in the latest price-sensitive company announcements or qualitative material. Simply Wall St has no position in any stocks mentioned.
About OB:PEN
Panoro Energy
An independent exploration and production company, engages in the exploration, development, and production of oil and gas properties in Africa.
Undervalued with reasonable growth potential.
Similar Companies
Market Insights

Advertisement
Community Narratives
Pinterest will surge as advertising innovations ignite revenue growth
Fair Value US$42.63|27.0% undervalued
BR
Community Contributor
Brambles' Revenue Set to Climb 14% with Profit Margins Following
Fair Value AU$21.90|5.9% overvalued
RO
Community Contributor
Challenging Future for STG as Organic Sales Decline by 8.8%
Fair Value DKK 116.13|26.8% undervalued
KA
Community Contributor