Advertisement
- Norway
- /
- Oil and Gas
- /
- OB:EQNR
Does the Recent Share Price Dip Present an Opportunity in Equinor for 2025?

Simply Wall St
Reviewed by Bailey Pemberton
If you’ve ever wondered whether Equinor deserves a spot in your portfolio, you’re not alone. The last few years have been anything but dull for this energy giant, and now, investors are grappling with a different question: is the stock too cheap to ignore, or are there risks lurking beneath the surface?
Let’s start with the numbers. Since peaking several years back, Equinor’s share price has been on quite a ride. Over the past five years, the stock has racked up an impressive 166.4% return. But zoom into the present, and things look a little less explosive. Year-to-date, it’s lost 11.3%, and the last month brought only a modest 2.4% gain. After a long period of outperformance, global energy prices have been shifting, and recent market developments have introduced new questions around risk and growth across the sector. Still, Equinor is holding its ground, closing recently at 246.9, with a tidy 0.9% gain over the last year.
Valuation? Here’s where it gets interesting. Out of six standard valuation checks, Equinor is considered undervalued in five. That gives it a robust value score of 5. If you’re focused on the numbers, that’s a clear signal this stock may be a bargain, assuming those checks hold water. But not all valuation methods are created equal. Let’s break down the most common ways investors assess a company like Equinor, and then dig into what might be the smartest way to judge its real worth.
Why Equinor is lagging behind its peers
Approach 1: Equinor Discounted Cash Flow (DCF) Analysis
The Discounted Cash Flow (DCF) model estimates the value of a company based on its expected future cash flows and then discounts those projections back to the present. Essentially, it helps investors gauge whether a stock appears cheap or expensive compared to the cash it is likely to generate in the years ahead.
For Equinor, the most recent twelve months saw Free Cash Flow (FCF) reach approximately $10.17 billion. Analyst projections expect this figure to fluctuate over the coming years, with forecasts placing FCF at about $6.1 billion by 2029. Beyond this point, projections are extrapolated using industry growth rates, but analyst certainty diminishes after the five-year mark, so it is advisable to view those further estimates with caution.
Plugging all of those forecasts into the DCF formula, the resulting intrinsic value comes out to $609.10 per share. With the current market price recently closing at 246.9 NOK, this means the model suggests Equinor is trading at a notable 59.5% discount to its intrinsic value.
Result: UNDERVALUED
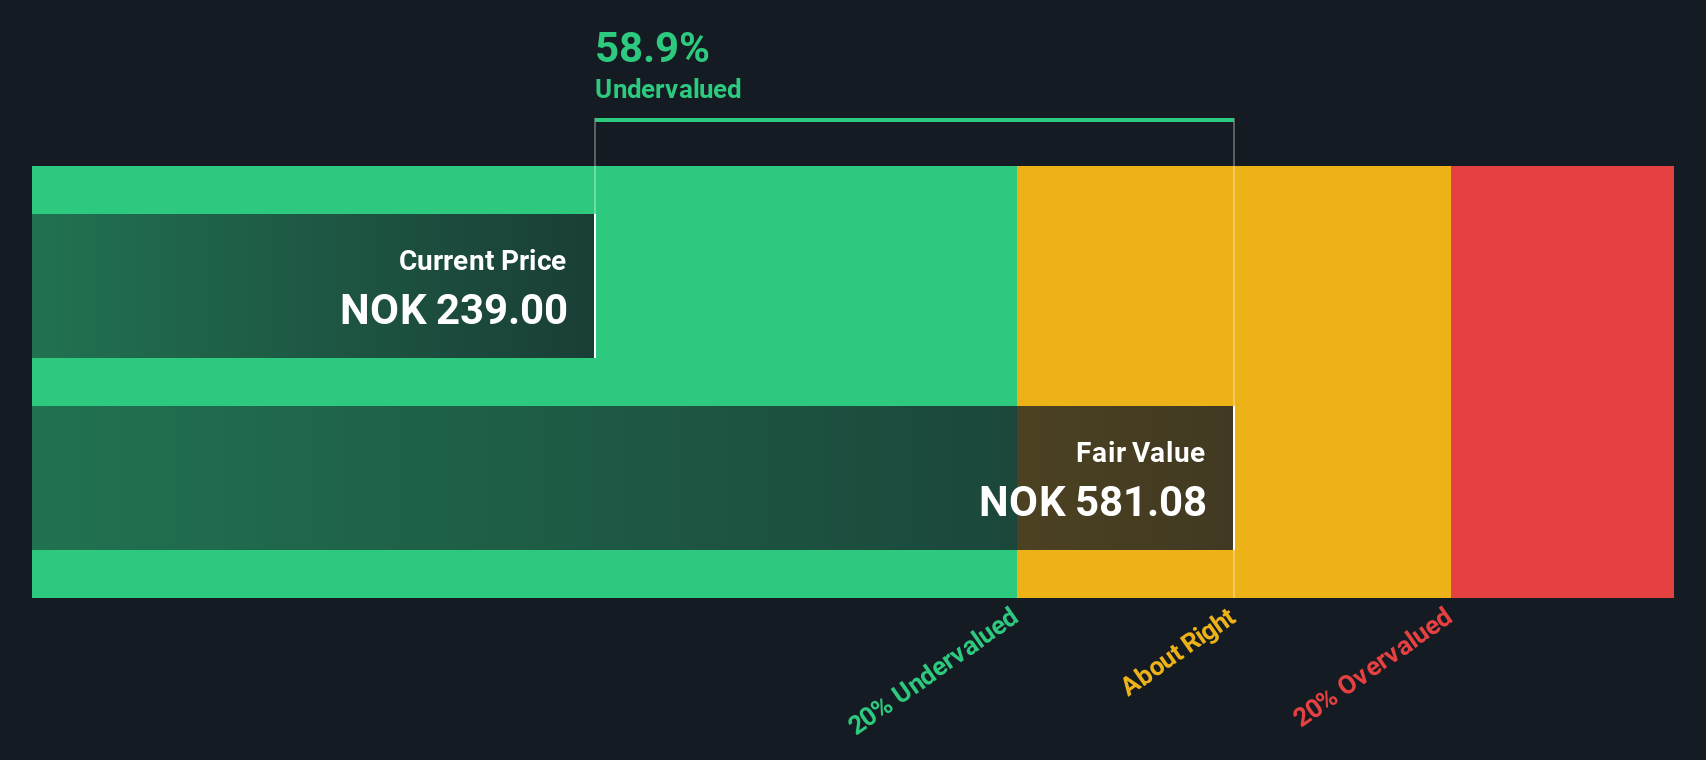
Our Discounted Cash Flow (DCF) analysis suggests Equinor is undervalued by 59.5%. Track this in your watchlist or portfolio, or discover more undervalued stocks.
Approach 2: Equinor Price vs Earnings
The price-to-earnings (PE) ratio is a favored yardstick for valuing profitable companies like Equinor, as it shows how much investors are willing to pay for each krone of current earnings. For businesses with steady profits, the PE ratio gives a window into how the market is pricing both current performance and future prospects.
Growth expectations and perceived risks play a significant role in what makes a “normal” or “fair” PE ratio. A higher growth rate can justify a loftier PE number, while greater risks or uncertain earnings typically call for a lower multiple. So, context is key—it is not just about a low or high PE on its own.
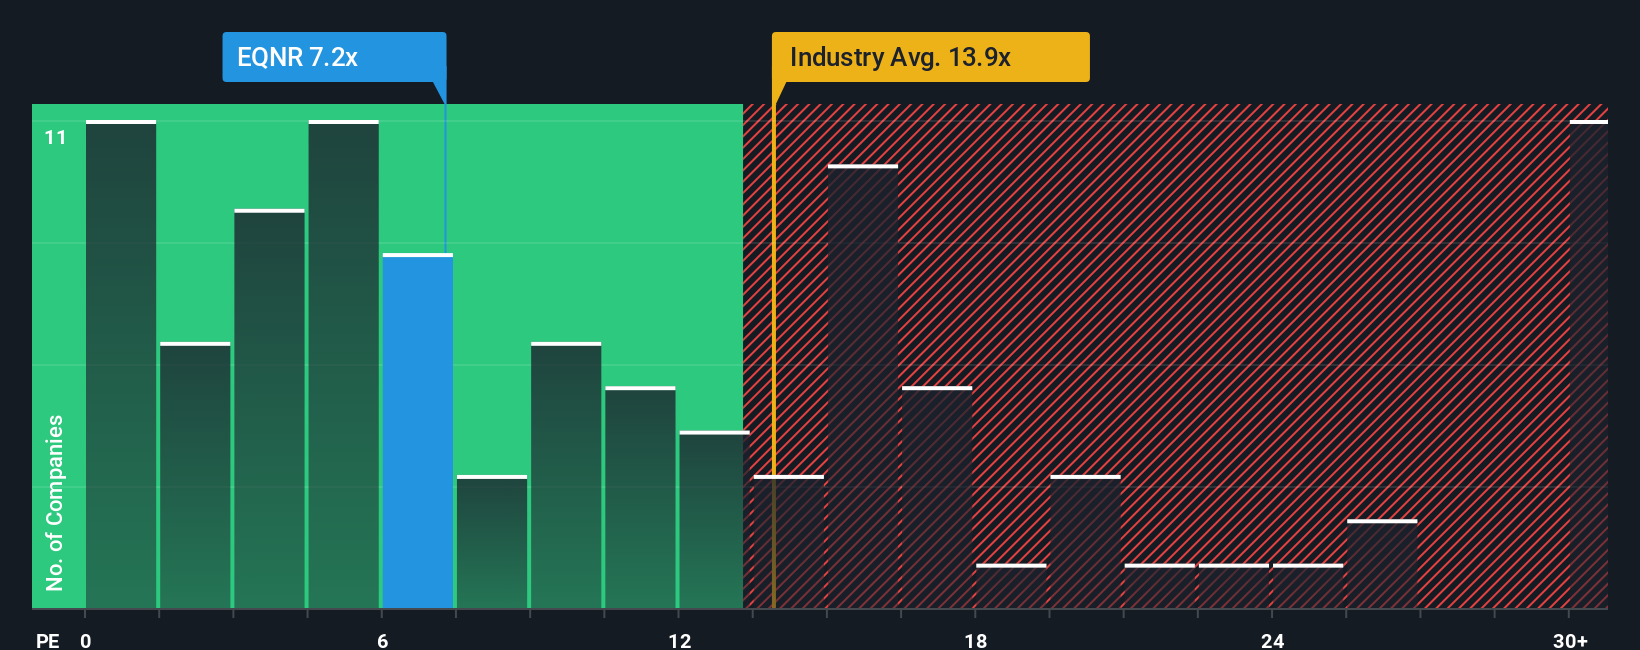
Currently, Equinor trades at a PE ratio of 7.58x. This is noticeably below the oil and gas industry average of 12.90x, and well under the peer group average of 15.91x. At first glance, the market seems to be offering a discount compared to competitors. But there is another lens worth using: Simply Wall St's “Fair Ratio.” This metric reflects not just peer and industry comparisons, but also factors in Equinor’s unique profile, including growth outlook, earnings quality, industry, and company-specific risks. For Equinor, the Fair Ratio comes in at 8.73x.
Because this Fair Ratio is only slightly higher than today’s PE, the stock looks priced about right, especially when all those underlying factors are considered holistically.
Result: ABOUT RIGHT
PE ratios tell one story, but what if the real opportunity lies elsewhere? Discover companies where insiders are betting big on explosive growth.
Upgrade Your Decision Making: Choose your Equinor Narrative
Earlier we mentioned that there's an even better way to understand valuation, so let's introduce you to Narratives. Narratives are a simple but powerful approach for investors to frame their view of a company by combining their personal story of what’s happening at Equinor with the numbers they believe in, like future revenues, profit margins, and ultimately their fair value for the stock.
Rather than just reacting to static ratios and established forecasts, Narratives invite you to connect your unique perspective, whether you’re convinced Equinor’s renewables expansion will offset oil’s decline or worried about regulatory headwinds, to a detailed financial forecast and a calculated fair value. This storytelling-meets-analysis tool is built right into Simply Wall St’s Community page, where millions of investors update and share their views in real time.
With Narratives, you can see when a stock is undervalued or overvalued for your view by directly comparing your Fair Value estimate with the live price, making buy and sell decisions more transparent and informed. Since each Narrative is updated automatically as earnings, news, or new risks emerge, you always have the latest picture for your thesis.
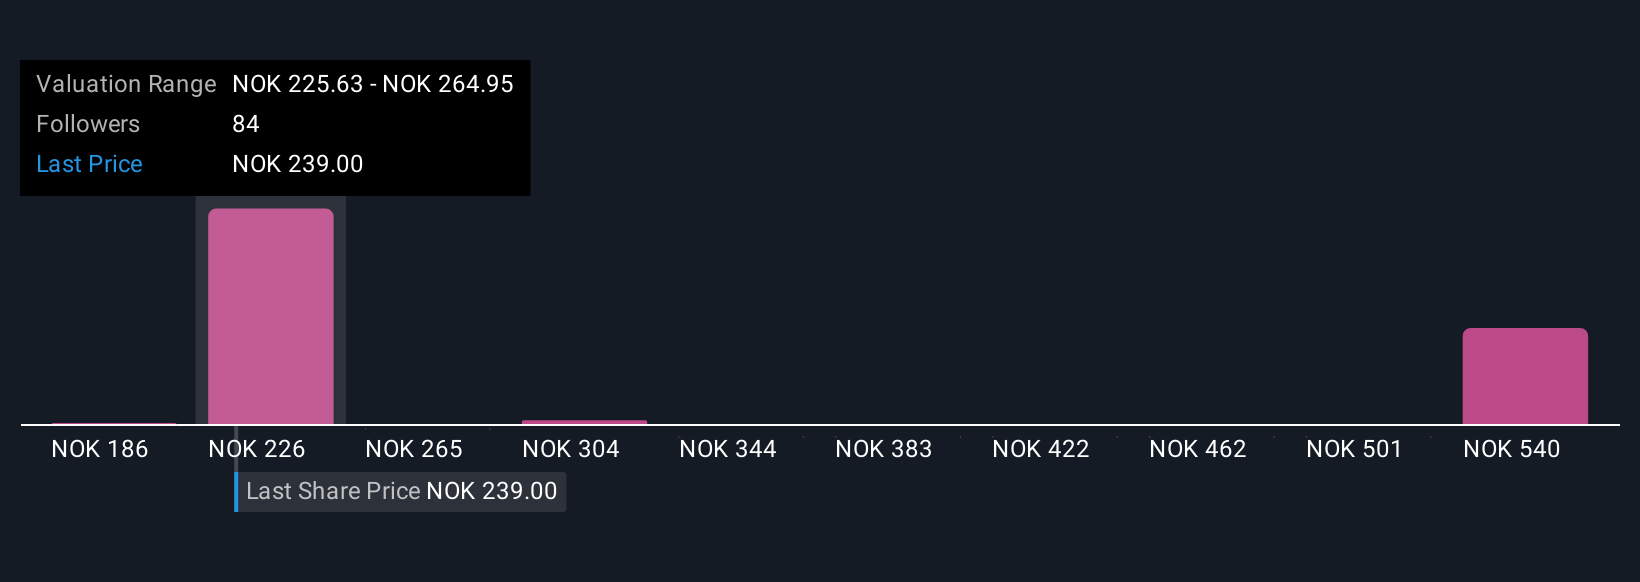
For Equinor, for example, some investors’ Narratives forecast a fair value as high as NOK320.92 if they expect sustained high margins and success in renewables, while others see much lower values, like NOK179.69, if they’re concerned about falling oil demand and growing ESG pressures.
Do you think there's more to the story for Equinor? Create your own Narrative to let the Community know!
This article by Simply Wall St is general in nature. We provide commentary based on historical data and analyst forecasts only using an unbiased methodology and our articles are not intended to be financial advice. It does not constitute a recommendation to buy or sell any stock, and does not take account of your objectives, or your financial situation. We aim to bring you long-term focused analysis driven by fundamental data. Note that our analysis may not factor in the latest price-sensitive company announcements or qualitative material. Simply Wall St has no position in any stocks mentioned.
Valuation is complex, but we're here to simplify it.
Discover if Equinor might be undervalued or overvalued with our detailed analysis, featuring fair value estimates, potential risks, dividends, insider trades, and its financial condition.
Access Free AnalysisHave feedback on this article? Concerned about the content? Get in touch with us directly. Alternatively, email editorial-team@simplywallst.com
About OB:EQNR
Equinor
An energy company, engages in the exploration, production, transportation, refining, and marketing of petroleum and other forms of energy in Norway and internationally.
Undervalued with excellent balance sheet and pays a dividend.
Similar Companies
Market Insights

Advertisement
Community Narratives
A formidable player in AI and enterprise computing.
Fair Value US$210.00|12.2% overvalued
CO
Community Contributor
IREN's Bold Moves in Sustainable Bitcoin Mining & AI Data Centers
Fair Value US$72.52|17.1% undervalued
BL
Community Contributor
Cooling the Champions: The Aussie Tech Behind F1's Victories
Fair Value AU$12.40|38.7% undervalued
TR
Community Contributor