- Norway
- /
- Commercial Services
- /
- OB:OCEAN
A Piece Of The Puzzle Missing From Ocean GeoLoop AS' (OB:OCEAN) 30% Share Price Climb


The Ocean GeoLoop AS (OB:OCEAN) share price has done very well over the last month, posting an excellent gain of 30%. The bad news is that even after the stocks recovery in the last 30 days, shareholders are still underwater by about 9.8% over the last year.
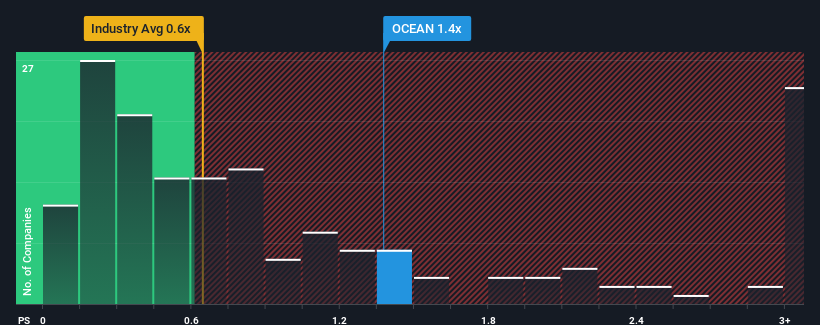
Although its price has surged higher, Ocean GeoLoop's price-to-sales (or "P/S") ratio of 1.4x might still make it look like a strong buy right now compared to the wider Commercial Services industry in Norway, where around half of the companies have P/S ratios above 10.8x and even P/S above 137x are quite common. Nonetheless, we'd need to dig a little deeper to determine if there is a rational basis for the highly reduced P/S.
View our latest analysis for Ocean GeoLoop
How Ocean GeoLoop Has Been Performing
Ocean GeoLoop certainly has been doing a great job lately as it's been growing its revenue at a really rapid pace. One possibility is that the P/S ratio is low because investors think this strong revenue growth might actually underperform the broader industry in the near future. Those who are bullish on Ocean GeoLoop will be hoping that this isn't the case, so that they can pick up the stock at a lower valuation.
Want the full picture on earnings, revenue and cash flow for the company? Then our free report on Ocean GeoLoop will help you shine a light on its historical performance.Do Revenue Forecasts Match The Low P/S Ratio?
There's an inherent assumption that a company should far underperform the industry for P/S ratios like Ocean GeoLoop's to be considered reasonable.
Taking a look back first, we see that the company grew revenue by an impressive 36% last year. The latest three year period has also seen an incredible overall rise in revenue, aided by its incredible short-term performance. Accordingly, shareholders would have been over the moon with those medium-term rates of revenue growth.
Comparing that to the industry, which is only predicted to deliver 135% growth in the next 12 months, the company's momentum is stronger based on recent medium-term annualised revenue results.
With this information, we find it odd that Ocean GeoLoop is trading at a P/S lower than the industry. Apparently some shareholders believe the recent performance has exceeded its limits and have been accepting significantly lower selling prices.
What Does Ocean GeoLoop's P/S Mean For Investors?
Ocean GeoLoop's recent share price jump still sees fails to bring its P/S alongside the industry median. While the price-to-sales ratio shouldn't be the defining factor in whether you buy a stock or not, it's quite a capable barometer of revenue expectations.
Our examination of Ocean GeoLoop revealed its three-year revenue trends aren't boosting its P/S anywhere near as much as we would have predicted, given they look better than current industry expectations. Potential investors that are sceptical over continued revenue performance may be preventing the P/S ratio from matching previous strong performance. It appears many are indeed anticipating revenue instability, because the persistence of these recent medium-term conditions would normally provide a boost to the share price.
Before you take the next step, you should know about the 3 warning signs for Ocean GeoLoop (1 is a bit concerning!) that we have uncovered.
If companies with solid past earnings growth is up your alley, you may wish to see this free collection of other companies with strong earnings growth and low P/E ratios.
If you're looking to trade Ocean GeoLoop, open an account with the lowest-cost platform trusted by professionals, Interactive Brokers.
With clients in over 200 countries and territories, and access to 160 markets, IBKR lets you trade stocks, options, futures, forex, bonds and funds from a single integrated account.
Enjoy no hidden fees, no account minimums, and FX conversion rates as low as 0.03%, far better than what most brokers offer.
Sponsored ContentNew: AI Stock Screener & Alerts
Our new AI Stock Screener scans the market every day to uncover opportunities.
• Dividend Powerhouses (3%+ Yield)
• Undervalued Small Caps with Insider Buying
• High growth Tech and AI Companies
Or build your own from over 50 metrics.
Have feedback on this article? Concerned about the content? Get in touch with us directly. Alternatively, email editorial-team (at) simplywallst.com.
This article by Simply Wall St is general in nature. We provide commentary based on historical data and analyst forecasts only using an unbiased methodology and our articles are not intended to be financial advice. It does not constitute a recommendation to buy or sell any stock, and does not take account of your objectives, or your financial situation. We aim to bring you long-term focused analysis driven by fundamental data. Note that our analysis may not factor in the latest price-sensitive company announcements or qualitative material. Simply Wall St has no position in any stocks mentioned.
About OB:OCEAN
Ocean GeoLoop
A green tech company, develops point source carbon capture in Norway.
Excellent balance sheet very low.
Market Insights

Community Narratives

