Stock Analysis
- Netherlands
- /
- Entertainment
- /
- ENXTAM:UMG
Those who invested in Universal Music Group (AMS:UMG) a year ago are up 14%

The simplest way to invest in stocks is to buy exchange traded funds. But one can do better than that by picking better than average stocks (as part of a diversified portfolio). For example, the Universal Music Group N.V. (AMS:UMG) share price is up 11% in the last 1 year, clearly besting the market return of around 7.3% (not including dividends). If it can keep that out-performance up over the long term, investors will do very well! Universal Music Group hasn't been listed for long, so it's still not clear if it is a long term winner.
Now it's worth having a look at the company's fundamentals too, because that will help us determine if the long term shareholder return has matched the performance of the underlying business.
View our latest analysis for Universal Music Group
There is no denying that markets are sometimes efficient, but prices do not always reflect underlying business performance. One flawed but reasonable way to assess how sentiment around a company has changed is to compare the earnings per share (EPS) with the share price.
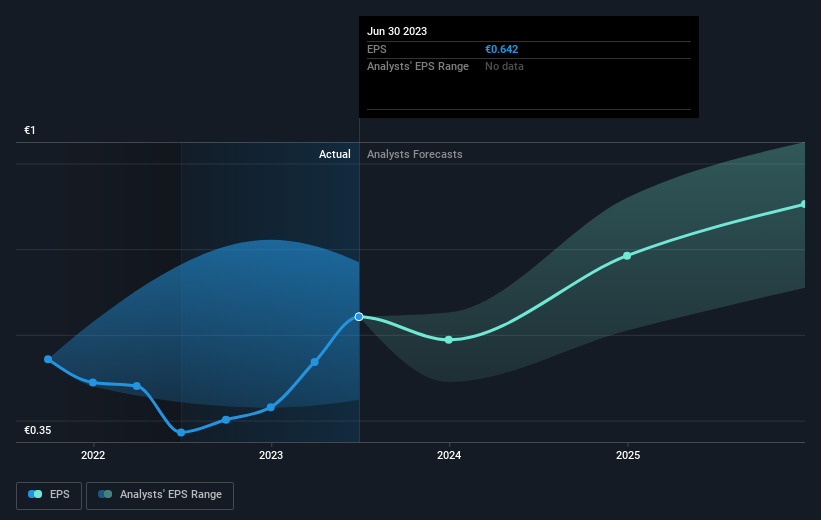
During the last year Universal Music Group grew its earnings per share (EPS) by 73%. This EPS growth is significantly higher than the 11% increase in the share price. Therefore, it seems the market isn't as excited about Universal Music Group as it was before. This could be an opportunity.
The company's earnings per share (over time) is depicted in the image below (click to see the exact numbers).
We know that Universal Music Group has improved its bottom line lately, but is it going to grow revenue? You could check out this free report showing analyst revenue forecasts.
What About Dividends?
It is important to consider the total shareholder return, as well as the share price return, for any given stock. Whereas the share price return only reflects the change in the share price, the TSR includes the value of dividends (assuming they were reinvested) and the benefit of any discounted capital raising or spin-off. Arguably, the TSR gives a more comprehensive picture of the return generated by a stock. As it happens, Universal Music Group's TSR for the last 1 year was 14%, which exceeds the share price return mentioned earlier. The dividends paid by the company have thusly boosted the total shareholder return.
A Different Perspective
It's nice to see that Universal Music Group shareholders have gained 14% over the last year, including dividends. And the share price momentum remains respectable, with a gain of 24% in the last three months. Demand for the stock from multiple parties is pushing the price higher; it could be that word is getting out about its virtues as a business. It's always interesting to track share price performance over the longer term. But to understand Universal Music Group better, we need to consider many other factors. For example, we've discovered 1 warning sign for Universal Music Group that you should be aware of before investing here.
We will like Universal Music Group better if we see some big insider buys. While we wait, check out this free list of growing companies with considerable, recent, insider buying.
Please note, the market returns quoted in this article reflect the market weighted average returns of stocks that currently trade on Dutch exchanges.
Valuation is complex, but we're helping make it simple.
Find out whether Universal Music Group is potentially over or undervalued by checking out our comprehensive analysis, which includes fair value estimates, risks and warnings, dividends, insider transactions and financial health.
View the Free AnalysisHave feedback on this article? Concerned about the content? Get in touch with us directly. Alternatively, email editorial-team (at) simplywallst.com.
This article by Simply Wall St is general in nature. We provide commentary based on historical data and analyst forecasts only using an unbiased methodology and our articles are not intended to be financial advice. It does not constitute a recommendation to buy or sell any stock, and does not take account of your objectives, or your financial situation. We aim to bring you long-term focused analysis driven by fundamental data. Note that our analysis may not factor in the latest price-sensitive company announcements or qualitative material. Simply Wall St has no position in any stocks mentioned.
About ENXTAM:UMG
Universal Music Group
Universal Music Group N.V. operates as a music company worldwide.
Outstanding track record with mediocre balance sheet.

