Stock Analysis
- Netherlands
- /
- Electrical
- /
- ENXTAM:TWEKA
TKH Group N.V.'s (AMS:TWEKA) Recent Stock Performance Looks Decent- Can Strong Fundamentals Be the Reason?


TKH Group's (AMS:TWEKA) stock is up by 4.3% over the past three months. Since the market usually pay for a company’s long-term financial health, we decided to study the company’s fundamentals to see if they could be influencing the market. Specifically, we decided to study TKH Group's ROE in this article.
Return on equity or ROE is an important factor to be considered by a shareholder because it tells them how effectively their capital is being reinvested. Simply put, it is used to assess the profitability of a company in relation to its equity capital.
View our latest analysis for TKH Group
How To Calculate Return On Equity?
Return on equity can be calculated by using the formula:
Return on Equity = Net Profit (from continuing operations) ÷ Shareholders' Equity
So, based on the above formula, the ROE for TKH Group is:
20% = €166m ÷ €836m (Based on the trailing twelve months to December 2023).
The 'return' is the amount earned after tax over the last twelve months. So, this means that for every €1 of its shareholder's investments, the company generates a profit of €0.20.
What Has ROE Got To Do With Earnings Growth?
We have already established that ROE serves as an efficient profit-generating gauge for a company's future earnings. Based on how much of its profits the company chooses to reinvest or "retain", we are then able to evaluate a company's future ability to generate profits. Assuming all else is equal, companies that have both a higher return on equity and higher profit retention are usually the ones that have a higher growth rate when compared to companies that don't have the same features.
TKH Group's Earnings Growth And 20% ROE
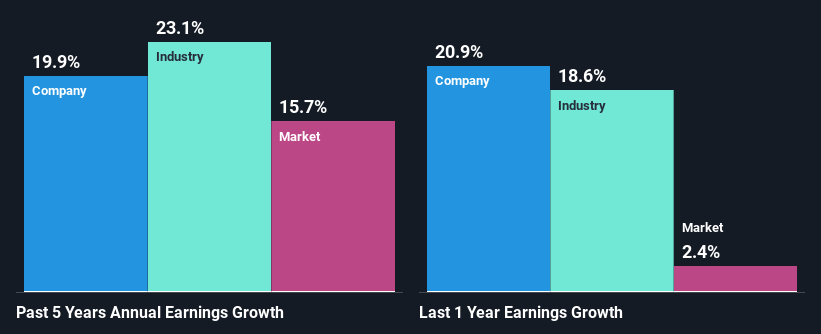
To begin with, TKH Group seems to have a respectable ROE. On comparing with the average industry ROE of 13% the company's ROE looks pretty remarkable. Probably as a result of this, TKH Group was able to see a decent growth of 20% over the last five years.
As a next step, we compared TKH Group's net income growth with the industry and found that the company has a similar growth figure when compared with the industry average growth rate of 23% in the same period.
Earnings growth is an important metric to consider when valuing a stock. It’s important for an investor to know whether the market has priced in the company's expected earnings growth (or decline). This then helps them determine if the stock is placed for a bright or bleak future. Has the market priced in the future outlook for TWEKA? You can find out in our latest intrinsic value infographic research report.
Is TKH Group Using Its Retained Earnings Effectively?
TKH Group has a healthy combination of a moderate three-year median payout ratio of 49% (or a retention ratio of 51%) and a respectable amount of growth in earnings as we saw above, meaning that the company has been making efficient use of its profits.
Besides, TKH Group has been paying dividends for at least ten years or more. This shows that the company is committed to sharing profits with its shareholders. Our latest analyst data shows that the future payout ratio of the company over the next three years is expected to be approximately 45%. Accordingly, forecasts suggest that TKH Group's future ROE will be 20% which is again, similar to the current ROE.
Conclusion
In total, we are pretty happy with TKH Group's performance. Specifically, we like that the company is reinvesting a huge chunk of its profits at a high rate of return. This of course has caused the company to see substantial growth in its earnings. With that said, the latest industry analyst forecasts reveal that the company's earnings growth is expected to slow down. To know more about the latest analysts predictions for the company, check out this visualization of analyst forecasts for the company.
Valuation is complex, but we're helping make it simple.
Find out whether TKH Group is potentially over or undervalued by checking out our comprehensive analysis, which includes fair value estimates, risks and warnings, dividends, insider transactions and financial health.
View the Free AnalysisHave feedback on this article? Concerned about the content? Get in touch with us directly. Alternatively, email editorial-team (at) simplywallst.com.
This article by Simply Wall St is general in nature. We provide commentary based on historical data and analyst forecasts only using an unbiased methodology and our articles are not intended to be financial advice. It does not constitute a recommendation to buy or sell any stock, and does not take account of your objectives, or your financial situation. We aim to bring you long-term focused analysis driven by fundamental data. Note that our analysis may not factor in the latest price-sensitive company announcements or qualitative material. Simply Wall St has no position in any stocks mentioned.
About ENXTAM:TWEKA
TKH Group
TKH Group N.V. develops and delivers smart vision, smart manufacturing, and smart connectivity systems in the Netherlands, Europe, Asia, North America, and internationally.
Very undervalued with proven track record.
