
Quote of the Week: “Talking about ETFs is like talking about people. There are good ones, and there are bad ones.” – Jack Bogle
Have you heard of Destiny Tech 100? It’s a recently listed fund that seems to have become an instant meme stock and caught some ETF investors off-guard. This fund’s popularity was a reminder that not everything that looks like an ETF is an ETF.
This week, we decided to highlight some of the intricacies and risks associated with different types of exchange traded products, to help you navigate the space confidently.
🎧 Would you prefer to listen to these insights? You can find the audio version on our Spotify, Apple podcasts or Youtube !
What Happened in Markets this Week?
Here’s a quick summary of what’s been going on:
- 🏦 Goldman Sachs ditches robo-advisor platform ( WSJ )
- Our take: Goldman Sachs is closing its robo-advisor business and selling the accounts to Betterment . Everyone was getting into the robo-advisory business a few years ago, but it turns out these businesses require a lot of patience. Typical customers are young, so accounts are relatively small, while fees are low. These platforms could turn out to be nice businesses, but it might take a few decades.
- 🚗 Tesla promises cheaper vehicles after all ( The Verge )
- Our take: Tesla is going through an identity crisis. Is it an automaker with shrinking margins, or a software/AI/robotaxi business? It’s going to take a long time for the second business to materialize, and in the meantime growth rates and margins are falling. We can probably expect quite a few more years of volatility while it proves who it is.
- 🇩🇰 Denmark launches largest wind farm tender to date ( Reuters )
- Our take: Denmark’s latest tender is for six wind farms with a combined capacity of 10GW. The turbines will need to be constructed by 2030, and should get the country to its goal of reducing CO2 emissions by 70% from 1990 levels. This round of contracts will not come with state subsidies, so it will be interesting to see how the bidding goes.
Next, here’s some of the key economic data released recently:
-
🇦🇺 Australia’s inflation rate fell to 3.6%.
- It was previously 4.1%, so this was a welcome decline, though slightly higher than the 3.4% consensus estimate.
-
🇺🇸 US durable good orders rose 2.6% over the last 12 months, which was higher than expected.
- However, last month's reading was revised from 1.4% to 0.7% so some of the increases may have been carried forward.
-
🇺🇸 US GDP Growth Rate fell sharply from 3.4% to 1.6%.
- The slowdown was even lower than the 2.3% expected, and reflects weakening household and government spending, as well as higher imports over exports.
Exchange Traded Products: Buyer Beware
ETFs, or exchange traded funds, are an easy and efficient way to invest in ‘the stock market’ by tracking market indexes, or gaining exposure to a specific sector, investment style, or theme.
But it’s crucial to understand the mechanics and structure of these funds.
Not every fund that trades on an exchange is what we know as an ETF. Strictly speaking, most of these funds are ETPs (exchange traded products) of which ETFs are the most common type.
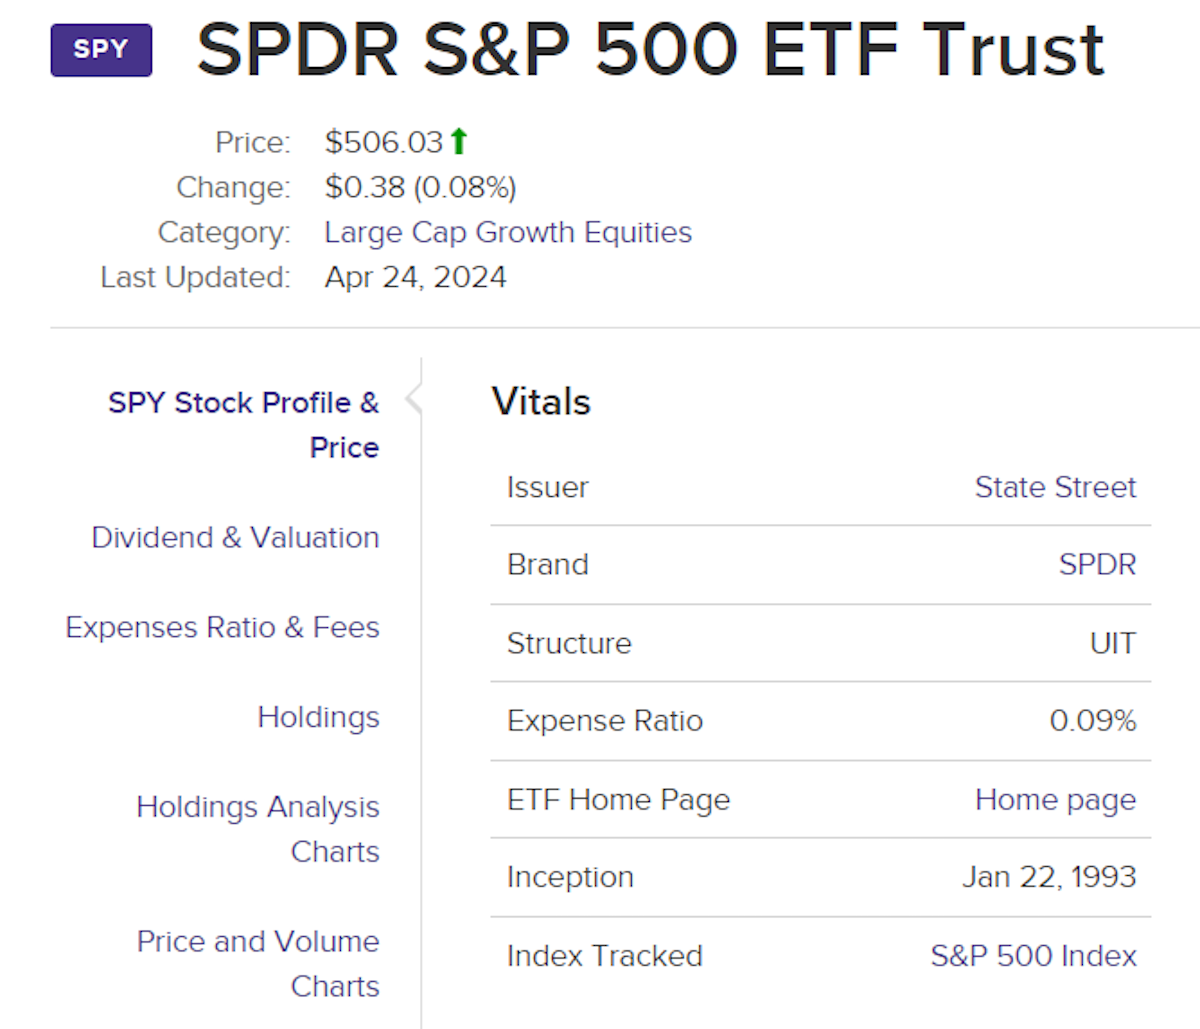
The structure of an ETP can affect the way it trades and the returns investors end up earning. To understand these other structures, we first need to understand how a standard ETF like the SPDR S&P 500 ETF Trust (SPY) works.
The Mechanics Of An ETF
Most equity and bond ETFs are open-ended investment funds that track an index. An ETF is managed by an issuer or management company, but the fund is an independent legal entity. The issuer or management company typically outsources the day to day management of the fund to a market maker.
The market maker’s job is to ensure the fund tracks the index and to enable investors to buy or sell shares as close as possible to the fund’s NAV (net asset value). When the fund’s share price is above the NAV, they sell shares, and when it falls below the NAV they buy shares.
To manage supply and demand, the market maker also creates and redeems shares.
✨ When new ETF shares are created, they sell those shares in the market and invest the proceeds in the underlying securities to match the index. If demand falls, they buy shares of the ETF in the market and sell the underlying securities.
This process means the size of the fund can rise and fall in line with demand, and the fund’s price remains relatively close to its NAV. The only obstacle to this process is the liquidity in the underlying assets, which can result in a wider tracking error.
Right now let’s look at something a little different that has caught the attention of investors over the last few weeks…
Destiny Tech100’s Wild Ride
The Destiny Tech100 fund which became publicly listed in March holds shares in private companies including SpaceX, OpenAI and Epic Games. Considering the average investor can’t even invest in these companies, it has an obvious appeal.
Here’s the problem though.
While technically this is a fund that is traded on an exchange, it’s very different from standard exchange traded funds. This fund is a closed-end management investment company.
This structure is more like an investment trust, which is really a listed company that owns shares in other companies. Investment trusts used to be very popular and are still common in some countries, particularly the UK.
The key difference is that this is a closed end fund.
New shares can’t be issued and redeemed on the fly like they can for ETFs. To issue new shares, an investment trust has to go through the process of a secondary offering, just like other companies do.
✨ With no mechanism to manage supply and demand, the share price of a fund like Destiny Tech100 is determined entirely by supply and demand. Investment trusts typically trade at a substantial discount to NAV, although they sometimes trade at a premium when they are new or unique.
The most recent financials put the NAV of this fund at $4.84 per share. This NAV is based on recent funding rounds and off market transactions in the underlying private companies. In other words, the NAV is based on transactions by professional venture capital investors, so they should be fairly reliable.
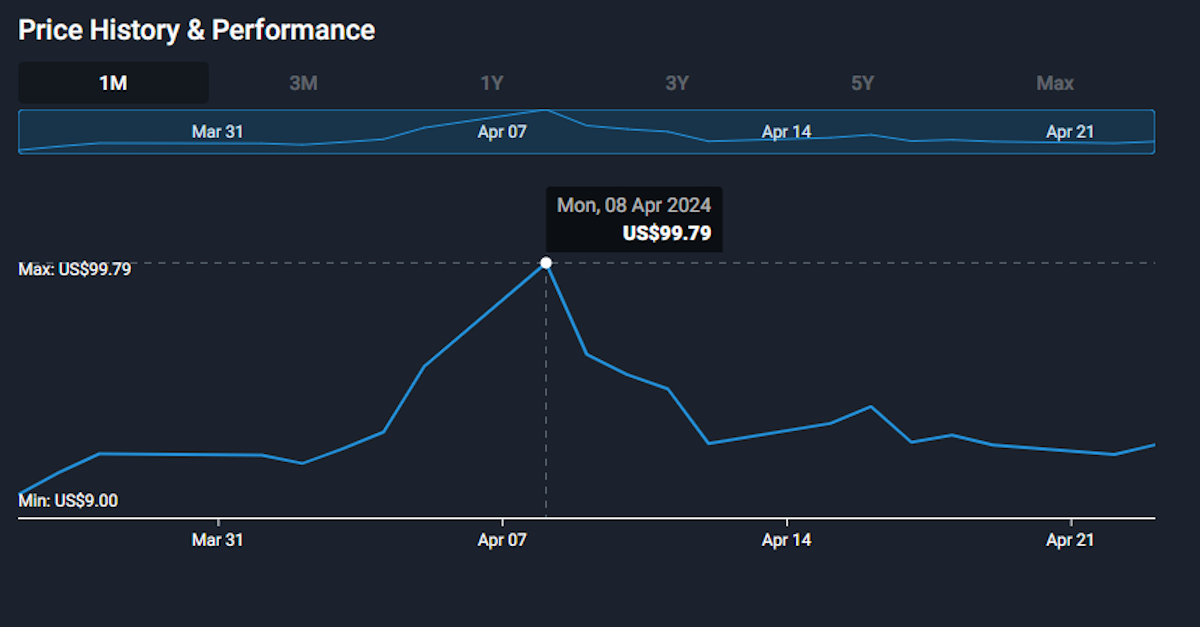
The fund started trading at $8.25 and rose to $105… within just 10 days.
This buying was no doubt driven by investors who were keen to invest in these underlying assets, but they didn’t know about or understand the NAV. It’s since fallen as low as $25 - which is still 5 times the reported NAV, so a huge premium.
You may be super keen to invest in companies like SpaceX, but at $25 you would be paying 400% more than venture capital funds.
✨ The moral of the story: Don’t invest in securities you don’t understand.
On a side note, Ark Invest manages a fund with similar holdings, but a very different structure.
The Ark Ventures Fund is more like a venture capital fund and isn’t tradable. Partial redemptions are allowed on a quarterly basis, but they are done at NAV minus relevant fees.
Successful companies are remaining private for longer, so there’s a lot of appetite for funds like the Destiny and ARK funds. Unfortunately, neither are ideal solutions. One offers liquidity at a massive premium, while the other is highly illiquid. There will probably be other options in the future - just make sure you understand them before you invest.
Other Fund Structures To Know About
Investment trusts aren’t usually listed on ETF websites like VettaFi (formerly ETFDB.com ) but there are a few other structures that are.
Standard ETFs in the US are usually classified as ETFs or UITs (for a handful of older funds). In the UK and EU they are classified as UCITs. The legal structure is usually listed along with the name of the issuer and the expense ratio on these sites.
🛢️ Exchange Traded Notes (ETNs)
ETNs are a fairly common structure for exchange traded products that track commodities, commodity indexes, as well as those that offer leverage and inverse exposure. You may also see ‘commodity and currency pools’ which are a similar structure.
These structures are used when the fund can’t simply invest in a basket of assets, and instead uses derivatives. ETNs are actually a type of Contract for Difference (CFD) with a long term expiry.
From a legal point of view, ETNs are more like a corporate bond, which means investors are taking on counterparty risk. If the issuer becomes insolvent, the ETN could become impaired or worthless, unlike ETFs which exist as independent entities.
Some ETNs are backed by collateral and many do a good job of tracking their benchmark - but it is important to know who the issuer is and decide whether you are happy to take on that credit risk.
There’s a second issue with some ETNs, particularly those that use derivatives to track commodity prices. Often these funds hold short-dated futures contracts and incur significant costs each time they roll the position into the next contract. This can lead to underperformance at times, or even most of the time.
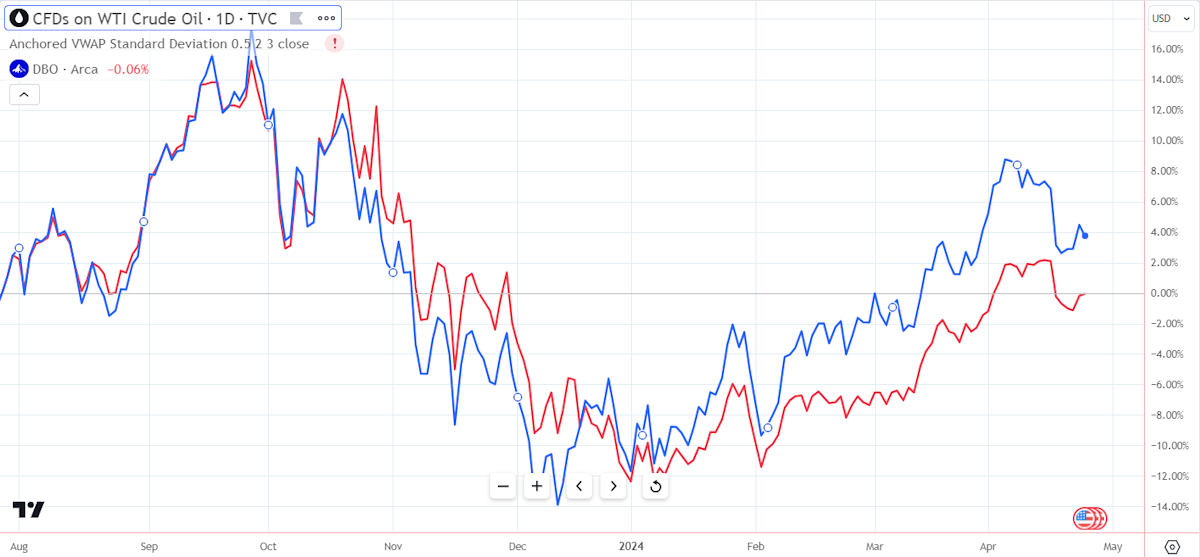
If you want to invest in a fund like this, check how well it tracks the asset you want to invest in (eg. crude oil) rather than the fund’s own benchmark.
Below you can see that the Invesco DB Oil fund (red) does a fairly good job of tracking the price of crude (blue) but does stray at times. The tracking error can change over time due to dynamics in the futures market.
🪙 Grantor Trusts
A grantor trust is an exchange traded fund that holds physical commodities or currencies. The world's largest gold and silver ETFs ( SPDR Gold Shares , iShares Silver Trust ) use this structure, as do the newly approved Bitcoin ETFs.
Grantor trusts are very similar to ETFs that hold equities or bonds, and should have very little tracking error. The only difference is that the assets need to be held somewhere, like a vault, a bank account, or a crypto wallet, rather than a share register.
Some investors are uncomfortable with this - but the alternative is buying and storing them yourself, which has its own drawbacks.
⚖️ Leveraged and Inverse ETFs
As mentioned, if you see an ETP that offers leverage or inverse exposure (i.e. they go up when the index goes down), it’s probably an ETN.
These are generally used for short term trading, but some investors use them for hedging. We wouldn’t recommend these types of products considering we’re long term investors - but if you are tempted, there’s another technicality to be aware of.
Both inverse and leveraged ETFs (and leveraged, inverse ETFs) use derivatives which need to be repositioned on a daily basis. This means that returns don’t compound as you would expect. They only serve their purpose over short periods of time, and the longer you hold them the more they underperform.
💡 The Insight: ETFs Can Be A Useful Tool
By investing in index tracking ETFs, you can earn the return of that index, or close to it after accounting for fees and transaction costs. But to earn market beating returns, you’ll need to invest in individual companies that can compound earnings for 10 to 20 years.
However, even if you are investing in individual companies, ETFs are still a useful tool and can have a place in most portfolios. Here are three examples where they make a lot of sense:
-
🌍 Core Portfolio
- If you are beginning your investment journey and still learning your way around the market, you could keep the bulk of your portfolio in a few ETFs.
- Then you can slowly move that capital into individual stocks as you build up confidence and get to know a handful of companies that you believe will earn great returns in the coming decades.
-
📈 📉 Reduce Volatility
- You may prefer to invest in a very concentrated portfolio, with just a handful of stocks that you know really well. This approach can lead to great long term returns, but that often comes with a lot of volatility. If you’re not a fan of that volatility, You can reduce that volatility by allocating a portion of your portfolio to broad market ETFs.
-
🔋 Thematic Investing
- Sector ETFs are an easy way to buy exposure to the sectors that you don’t understand or aren’t interested in researching fully, but where you feel you should have some exposure.
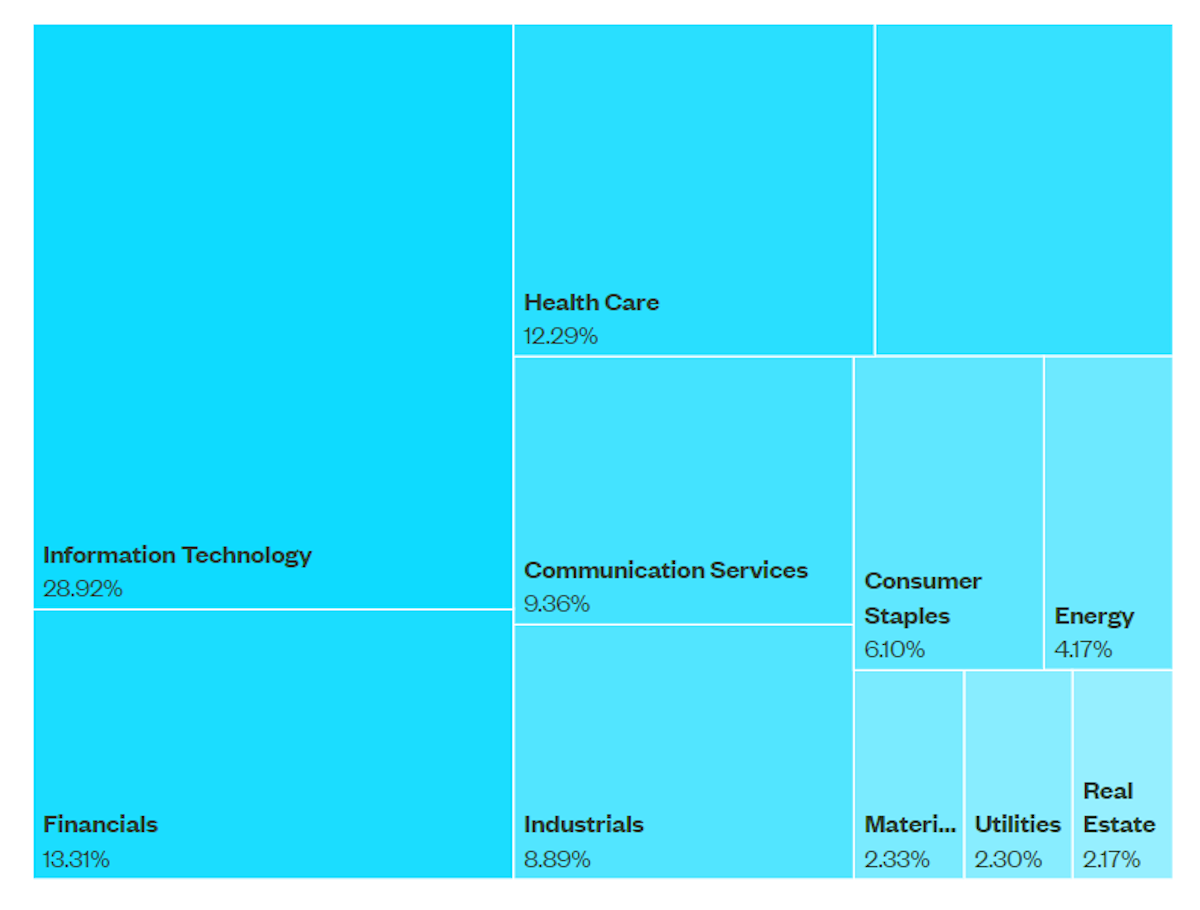
- The energy sector springs to mind here; energy stocks are a great hedge against inflation shocks, but not everyone wants to delve into the intricacies of energy companies. For sectors like this, you can match the sector weighting (see S&P 500 sector weights below) with appropriate sector ETFs - and then invest the remainder of your account in individual companies.
Key Events During The Next Week
It’s Fed Funds week, and while no change in rates is expected, the press conference will be closely watched for indications of the US central bank’s current thoughts on inflation.
Monday
- 🇩🇪 Germany’s year-on-year inflation rate is forecast to rise from 2.2% to 2.3%
Tuesday
- 🇨🇳 Manufacturing data in China is expected to show a continuing recovery in manufacturing. The NBS Manufacturing PMI for the month of April is estimated to be 51.2, up from 50.8, while the Caixin Manufacturing PMI is expected to rise from 51.1 to 51.3.
- 🇫🇷 France’s April inflation rate is expected to rise from 2.3% to 2.4% on a year-on-year basis
Wednesday
- 🇺🇸 US employment data is due. The ADP national employment report is expected to show new jobs had fallen slightly, from 184k to 162k in March.
- 🇺🇸 The JOLTs job opening report is forecast to show job openings continuing their gradual decline from 8.76 million to 8.7 million.
- 🇺🇸 The US Fed is expected to keep the Fed Funds target range at 5.25 to 5.50%.
Thursday
- 🇦🇺 Australia’s March trade surplus is expected to rise slightly, from AU$7.2 billion to AU$7.9 billion.
- 🇨🇦 Canada’s March trade surplus is expected to rise to CA$3.3 billion, up from CA$1.39 billion.
Friday
- 🇺🇲 The US employment rate is expected to remain at 3.8%, while non-farm payrolls are forecast to fall by 113k to 190k.
The remaining ‘Big Tech’ companies will be reporting, along with large caps in other sectors.
These are the largest companies reporting this week, but there are lots more. Check out the Nasdaq website for a comprehensive list.
- Amazon
- Apple
- AMD
- Qualcomm
- NXP Semiconductor
- ON Semiconductor
- Eli Lilly
- Pfizer
- Berkshire Hathaway
- Mastercard
- Coca-Cola
- McDonald’s
- Starbucks
Have feedback on this article? Concerned about the content? Get in touch with us directly. Alternatively, email editorial-team@simplywallst.com
Simply Wall St analyst Richard Bowman and Simply Wall St have no position in any of the companies mentioned. This article is general in nature. We provide commentary based on historical data and analyst forecasts only using an unbiased methodology and our articles are not intended to be financial advice. It does not constitute a recommendation to buy or sell any stock and does not take account of your objectives, or your financial situation. We aim to bring you long-term focused analysis driven by fundamental data. Note that our analysis may not factor in the latest price-sensitive company announcements or qualitative material.
Richard Bowman
Richard is an analyst, writer and investor based in Cape Town, South Africa. He has written for several online investment publications and continues to do so. Richard is fascinated by economics, financial markets and behavioral finance. He is also passionate about tools and content that make investing accessible to everyone.

