

Key Insights
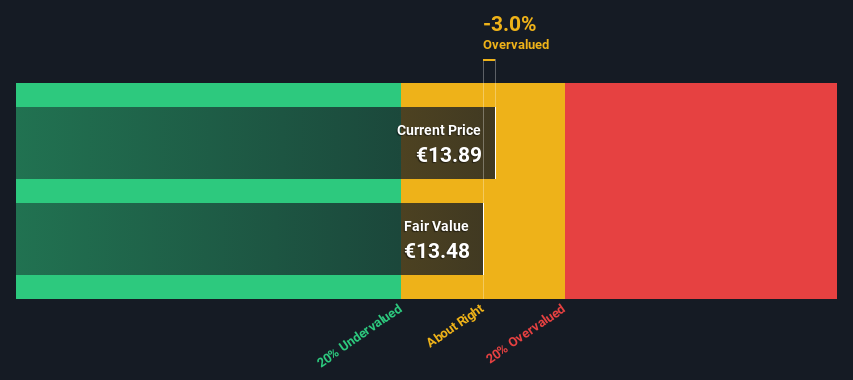
- SBM Offshore's estimated fair value is €13.48 based on Dividend Discount Model
- Current share price of €13.89 suggests SBM Offshore is potentially trading close to its fair value
- Our fair value estimate is 32% lower than SBM Offshore's analyst price target of US$19.93
Does the May share price for SBM Offshore N.V. (AMS:SBMO) reflect what it's really worth? Today, we will estimate the stock's intrinsic value by taking the expected future cash flows and discounting them to their present value. This will be done using the Discounted Cash Flow (DCF) model. It may sound complicated, but actually it is quite simple!
We generally believe that a company's value is the present value of all of the cash it will generate in the future. However, a DCF is just one valuation metric among many, and it is not without flaws. Anyone interested in learning a bit more about intrinsic value should have a read of the Simply Wall St analysis model.
See our latest analysis for SBM Offshore
The Method
We have to calculate the value of SBM Offshore slightly differently to other stocks because it is a energy services company. Instead of using free cash flows, which are hard to estimate and often not reported by analysts in this industry, dividends per share (DPS) payments are used. Unless a company pays out the majority of its FCF as a dividend, this method will typically underestimate the value of the stock. The 'Gordon Growth Model' is used, which simply assumes that dividend payments will continue to increase at a sustainable growth rate forever. For a number of reasons a very conservative growth rate is used that cannot exceed that of a company's Gross Domestic Product (GDP). In this case we used the 5-year average of the 10-year government bond yield (0.9%). The expected dividend per share is then discounted to today's value at a cost of equity of 8.8%. Relative to the current share price of €13.9, the company appears around fair value at the time of writing. The assumptions in any calculation have a big impact on the valuation, so it is better to view this as a rough estimate, not precise down to the last cent.
Value Per Share = Expected Dividend Per Share / (Discount Rate - Perpetual Growth Rate)
= US$1.2 / (8.8% – 0.9%)
= €13.5
Important Assumptions
Now the most important inputs to a discounted cash flow are the discount rate, and of course, the actual cash flows. Part of investing is coming up with your own evaluation of a company's future performance, so try the calculation yourself and check your own assumptions. The DCF also does not consider the possible cyclicality of an industry, or a company's future capital requirements, so it does not give a full picture of a company's potential performance. Given that we are looking at SBM Offshore as potential shareholders, the cost of equity is used as the discount rate, rather than the cost of capital (or weighted average cost of capital, WACC) which accounts for debt. In this calculation we've used 8.8%, which is based on a levered beta of 1.724. Beta is a measure of a stock's volatility, compared to the market as a whole. We get our beta from the industry average beta of globally comparable companies, with an imposed limit between 0.8 and 2.0, which is a reasonable range for a stable business.
SWOT Analysis for SBM Offshore
- Debt is well covered by .
- Earnings growth over the past year underperformed the Energy Services industry.
- Interest payments on debt are not well covered.
- Dividend is low compared to the top 25% of dividend payers in the Energy Services market.
- Good value based on P/E ratio compared to estimated Fair P/E ratio.
- Debt is not well covered by operating cash flow.
- Paying a dividend but company has no free cash flows.
- Annual earnings are forecast to decline for the next 3 years.
Looking Ahead:
Valuation is only one side of the coin in terms of building your investment thesis, and it is only one of many factors that you need to assess for a company. DCF models are not the be-all and end-all of investment valuation. Instead the best use for a DCF model is to test certain assumptions and theories to see if they would lead to the company being undervalued or overvalued. If a company grows at a different rate, or if its cost of equity or risk free rate changes sharply, the output can look very different. For SBM Offshore, we've compiled three pertinent items you should further research:
- Risks: To that end, you should learn about the 3 warning signs we've spotted with SBM Offshore (including 2 which are significant) .
- Future Earnings: How does SBMO's growth rate compare to its peers and the wider market? Dig deeper into the analyst consensus number for the upcoming years by interacting with our free analyst growth expectation chart.
- Other High Quality Alternatives: Do you like a good all-rounder? Explore our interactive list of high quality stocks to get an idea of what else is out there you may be missing!
PS. The Simply Wall St app conducts a discounted cash flow valuation for every stock on the ENXTAM every day. If you want to find the calculation for other stocks just search here.
New: Manage All Your Stock Portfolios in One Place
We've created the ultimate portfolio companion for stock investors, and it's free.
• Connect an unlimited number of Portfolios and see your total in one currency
• Be alerted to new Warning Signs or Risks via email or mobile
• Track the Fair Value of your stocks
Have feedback on this article? Concerned about the content? Get in touch with us directly. Alternatively, email editorial-team (at) simplywallst.com.
This article by Simply Wall St is general in nature. We provide commentary based on historical data and analyst forecasts only using an unbiased methodology and our articles are not intended to be financial advice. It does not constitute a recommendation to buy or sell any stock, and does not take account of your objectives, or your financial situation. We aim to bring you long-term focused analysis driven by fundamental data. Note that our analysis may not factor in the latest price-sensitive company announcements or qualitative material. Simply Wall St has no position in any stocks mentioned.
About ENXTAM:SBMO
SBM Offshore
Provides floating production solutions to the offshore energy industry worldwide.
High growth potential slight.
Similar Companies
Market Insights

Community Narratives
