
Advertisement
- Netherlands
- /
- Capital Markets
- /
- ENXTAM:VLK
Despite lower earnings than a year ago, Van Lanschot Kempen (AMS:VLK) investors are up 34% since then

If you want to compound wealth in the stock market, you can do so by buying an index fund. But you can significantly boost your returns by picking above-average stocks. To wit, the Van Lanschot Kempen NV (AMS:VLK) share price is 16% higher than it was a year ago, much better than the market decline of around 4.1% (not including dividends) in the same period. So that should have shareholders smiling. We'll need to follow Van Lanschot Kempen for a while to get a better sense of its share price trend, since it hasn't been listed for particularly long.
While this past week has detracted from the company's one-year return, let's look at the recent trends of the underlying business and see if the gains have been in alignment.
View our latest analysis for Van Lanschot Kempen
To paraphrase Benjamin Graham: Over the short term the market is a voting machine, but over the long term it's a weighing machine. By comparing earnings per share (EPS) and share price changes over time, we can get a feel for how investor attitudes to a company have morphed over time.
Over the last twelve months, Van Lanschot Kempen actually shrank its EPS by 43%.
So we don't think that investors are paying too much attention to EPS. Since the change in EPS doesn't seem to correlate with the change in share price, it's worth taking a look at other metrics.
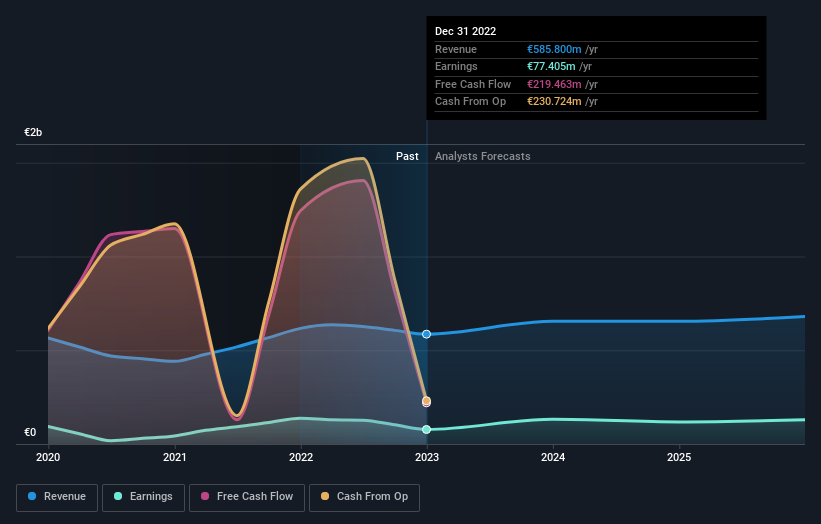
Absent any improvement, we don't think a thirst for dividends is pushing up the Van Lanschot Kempen's share price. Revenue actually dropped 5.0% over last year. Usually that correlates with a lower share price, but let's face it, the gyrations of the market are sometimes only as clear as mud.
The image below shows how earnings and revenue have tracked over time (if you click on the image you can see greater detail).
This free interactive report on Van Lanschot Kempen's balance sheet strength is a great place to start, if you want to investigate the stock further.
What About Dividends?
When looking at investment returns, it is important to consider the difference between total shareholder return (TSR) and share price return. The TSR incorporates the value of any spin-offs or discounted capital raisings, along with any dividends, based on the assumption that the dividends are reinvested. So for companies that pay a generous dividend, the TSR is often a lot higher than the share price return. In the case of Van Lanschot Kempen, it has a TSR of 34% for the last 1 year. That exceeds its share price return that we previously mentioned. This is largely a result of its dividend payments!
A Different Perspective
It's nice to see that Van Lanschot Kempen shareholders have gained 34% over the last year, including dividends. A substantial portion of that gain has come in the last three months, with the stock up 19% in that time. Demand for the stock from multiple parties is pushing the price higher; it could be that word is getting out about its virtues as a business. While it is well worth considering the different impacts that market conditions can have on the share price, there are other factors that are even more important. Take risks, for example - Van Lanschot Kempen has 2 warning signs we think you should be aware of.
If you like to buy stocks alongside management, then you might just love this free list of companies. (Hint: insiders have been buying them).
Please note, the market returns quoted in this article reflect the market weighted average returns of stocks that currently trade on Dutch exchanges.
New: Manage All Your Stock Portfolios in One Place
We've created the ultimate portfolio companion for stock investors, and it's free.
• Connect an unlimited number of Portfolios and see your total in one currency
• Be alerted to new Warning Signs or Risks via email or mobile
• Track the Fair Value of your stocks
Have feedback on this article? Concerned about the content? Get in touch with us directly. Alternatively, email editorial-team (at) simplywallst.com.
This article by Simply Wall St is general in nature. We provide commentary based on historical data and analyst forecasts only using an unbiased methodology and our articles are not intended to be financial advice. It does not constitute a recommendation to buy or sell any stock, and does not take account of your objectives, or your financial situation. We aim to bring you long-term focused analysis driven by fundamental data. Note that our analysis may not factor in the latest price-sensitive company announcements or qualitative material. Simply Wall St has no position in any stocks mentioned.
About ENXTAM:VLK
Van Lanschot Kempen
Provides various financial services in the Netherlands, Belgium, and internationally.
Excellent balance sheet with acceptable track record.
Similar Companies
Market Insights

Advertisement
Community Narratives
Groundbreaking therapies that could change the treatment landscape for PTSD, fibromyalgia, MS & Alzheimer’s
Fair Value US$6.20|82.7% undervalued
CM
Community Contributor
DigitalOcean Will Grow 14% by Embracing AI with Paperspace Acquisition
Fair Value US$50.00|36.8% undervalued
NE
Community Contributor
Viant Technology: A Rising AdTech Challenger in the AI-Powered CTV Market
Fair Value US$38.61|61.4% undervalued
BL
Community Contributor
Volvo will Accelerate Forward into Electric and Autonomous Leadership in Five Years
Fair Value SEK 438.80|37.1% undervalued
UN
Community Contributor