
Advertisement
- Netherlands
- /
- Electrical
- /
- ENXTAM:TWEKA
TKH Group N.V.'s (AMS:TWEKA) CEO Compensation Is Looking A Bit Stretched At The Moment
Key Insights
- TKH Group will host its Annual General Meeting on 7th of May
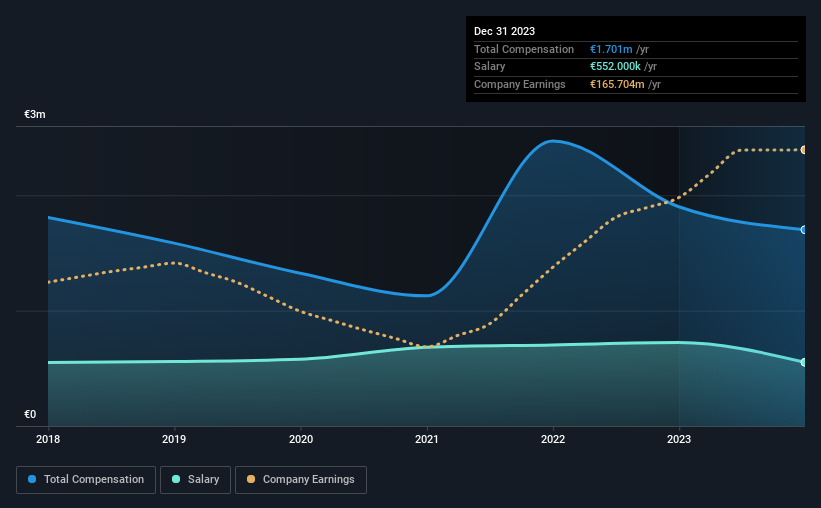
- CEO J. M. Van Der Lof's total compensation includes salary of €552.0k
- The total compensation is 103% higher than the average for the industry
- TKH Group's total shareholder return over the past three years was 11% while its EPS grew by 54% over the past three years
CEO J. M. Van Der Lof has done a decent job of delivering relatively good performance at TKH Group N.V. (AMS:TWEKA) recently. In light of this performance, CEO compensation will probably not be the main focus for shareholders as they go into the AGM on 7th of May. However, some shareholders may still want to keep CEO compensation within reason.
Check out our latest analysis for TKH Group
How Does Total Compensation For J. M. Van Der Lof Compare With Other Companies In The Industry?
At the time of writing, our data shows that TKH Group N.V. has a market capitalization of €1.6b, and reported total annual CEO compensation of €1.7m for the year to December 2023. That's a notable decrease of 10% on last year. While we always look at total compensation first, our analysis shows that the salary component is less, at €552k.
In comparison with other companies in the the Netherlands Electrical industry with market capitalizations ranging from €937m to €3.0b, the reported median CEO total compensation was €837k. This suggests that J. M. Van Der Lof is paid more than the median for the industry. Furthermore, J. M. Van Der Lof directly owns €5.3m worth of shares in the company, implying that they are deeply invested in the company's success.
| Component | 2023 | 2022 | Proportion (2023) |
| Salary | €552k | €723k | 32% |
| Other | €1.1m | €1.2m | 68% |
| Total Compensation | €1.7m | €1.9m | 100% |
On an industry level, roughly 52% of total compensation represents salary and 48% is other remuneration. TKH Group sets aside a smaller share of compensation for salary, in comparison to the overall industry. If non-salary compensation dominates total pay, it's an indicator that the executive's salary is tied to company performance.
A Look at TKH Group N.V.'s Growth Numbers
Over the past three years, TKH Group N.V. has seen its earnings per share (EPS) grow by 54% per year. It achieved revenue growth of 1.7% over the last year.
Shareholders would be glad to know that the company has improved itself over the last few years. It's nice to see revenue heading northwards, as this is consistent with healthy business conditions. Moving away from current form for a second, it could be important to check this free visual depiction of what analysts expect for the future.
Has TKH Group N.V. Been A Good Investment?
TKH Group N.V. has generated a total shareholder return of 11% over three years, so most shareholders would be reasonably content. But they would probably prefer not to see CEO compensation far in excess of the median.
To Conclude...
The company's decent performance might have made most shareholders happy, possibly making CEO remuneration the least of the concerns to be discussed in the upcoming AGM. However, if the board proposes to increase the compensation, some shareholders might have questions given that the CEO is already being paid higher than the industry.
It is always advisable to analyse CEO pay, along with performing a thorough analysis of the company's key performance areas. In our study, we found 3 warning signs for TKH Group you should be aware of, and 1 of them is a bit unpleasant.
Of course, you might find a fantastic investment by looking at a different set of stocks. So take a peek at this free list of interesting companies.
Valuation is complex, but we're here to simplify it.
Discover if TKH Group might be undervalued or overvalued with our detailed analysis, featuring fair value estimates, potential risks, dividends, insider trades, and its financial condition.
Access Free AnalysisHave feedback on this article? Concerned about the content? Get in touch with us directly. Alternatively, email editorial-team (at) simplywallst.com.
This article by Simply Wall St is general in nature. We provide commentary based on historical data and analyst forecasts only using an unbiased methodology and our articles are not intended to be financial advice. It does not constitute a recommendation to buy or sell any stock, and does not take account of your objectives, or your financial situation. We aim to bring you long-term focused analysis driven by fundamental data. Note that our analysis may not factor in the latest price-sensitive company announcements or qualitative material. Simply Wall St has no position in any stocks mentioned.
About ENXTAM:TWEKA
TKH Group
Develops and delivers smart vision, smart manufacturing, and smart connectivity systems in the Netherlands, rest of Europe, Asia, North America, and internationally.
Adequate balance sheet with slight risk.
Market Insights


Advertisement
Community Narratives
America Wants Homegrown Drones — Draganfly Is Ready to Deliver
Fair Value US$9.21|24.5% undervalued
JO
Community Contributor
Cheesecake Factory offers an enticing opportunity for long-term growth by leveraging new concepts
Fair Value US$73.83|24.8% undervalued
ZW
Community Contributor
Coca-Cola’s Intrinsic Value Set to Rise with Fed Rate Cut
Fair Value US$67.50|2.2% undervalued
AL
Community Contributor
Fully Permitted Gold Mine with 50 Baggers Potential 
Fair Value CA$41.00|97.7% undervalued
RO
Community Contributor