- Netherlands
- /
- Machinery
- /
- ENXTAM:AALB
Top 3 Dividend Stocks On Euronext Amsterdam In September 2024

Reviewed by Simply Wall St

As European inflation nears the central bank's target and the pan-European STOXX Europe 600 Index reaches record highs, investors are increasingly looking at dividend stocks on Euronext Amsterdam for stable returns. In this context, a good dividend stock is one that not only offers reliable payouts but also demonstrates resilience amidst fluctuating economic conditions.
Top 5 Dividend Stocks In The Netherlands
| Name | Dividend Yield | Dividend Rating |
| Koninklijke Heijmans (ENXTAM:HEIJM) | 3.67% | ★★★★☆☆ |
| Aalberts (ENXTAM:AALB) | 3.24% | ★★★★☆☆ |
| Randstad (ENXTAM:RAND) | 5.26% | ★★★★☆☆ |
| ABN AMRO Bank (ENXTAM:ABN) | 9.78% | ★★★★☆☆ |
| Signify (ENXTAM:LIGHT) | 7.28% | ★★★★☆☆ |
| ING Groep (ENXTAM:INGA) | 6.81% | ★★★★☆☆ |
| Acomo (ENXTAM:ACOMO) | 6.66% | ★★★★☆☆ |
Let's explore several standout options from the results in the screener.
Aalberts (ENXTAM:AALB)
Simply Wall St Dividend Rating: ★★★★☆☆
Overview: Aalberts N.V. provides mission-critical technologies for the aerospace, automotive, building, and maritime sectors with a market cap of €3.85 billion.
Operations: Aalberts N.V. generates revenue through its Building Technology segment (€1.74 billion) and Industrial Technology segment (€1.49 billion).
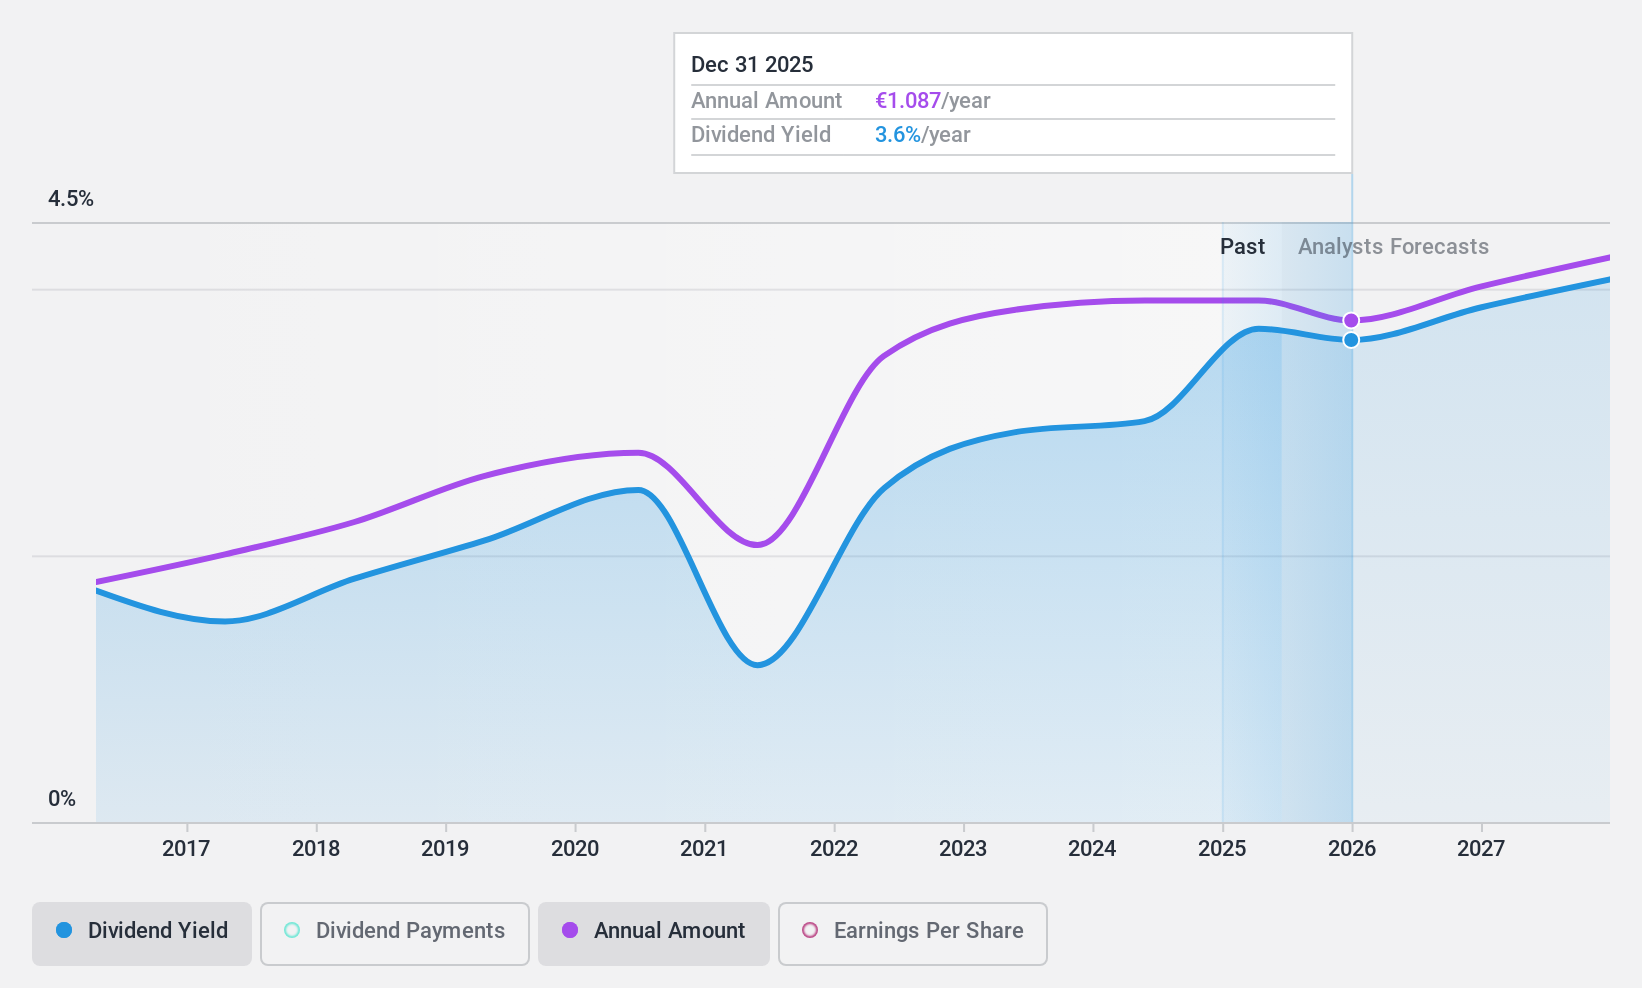
Dividend Yield: 3.2%
Aalberts' dividend payments have been volatile over the past decade, despite a reasonable payout ratio of 41% and cash flow coverage at 60.4%. Recent earnings showed a slight decline, with net income at €149.2 million for H1 2024 compared to €160 million the previous year. The company is trading below its fair value estimate and peers, but insider selling has been significant recently. The dividend yield remains lower than top-tier Dutch payers at 3.24%.
- Delve into the full analysis dividend report here for a deeper understanding of Aalberts.
- Our valuation report here indicates Aalberts may be undervalued.
Koninklijke Heijmans (ENXTAM:HEIJM)
Simply Wall St Dividend Rating: ★★★★☆☆
Overview: Koninklijke Heijmans N.V. operates in property development, construction, and infrastructure sectors both in the Netherlands and internationally with a market cap of €650.53 million.
Operations: Koninklijke Heijmans N.V. generates revenue from Connecting (€871.03 million) and Segment Adjustment (€1.83 billion).
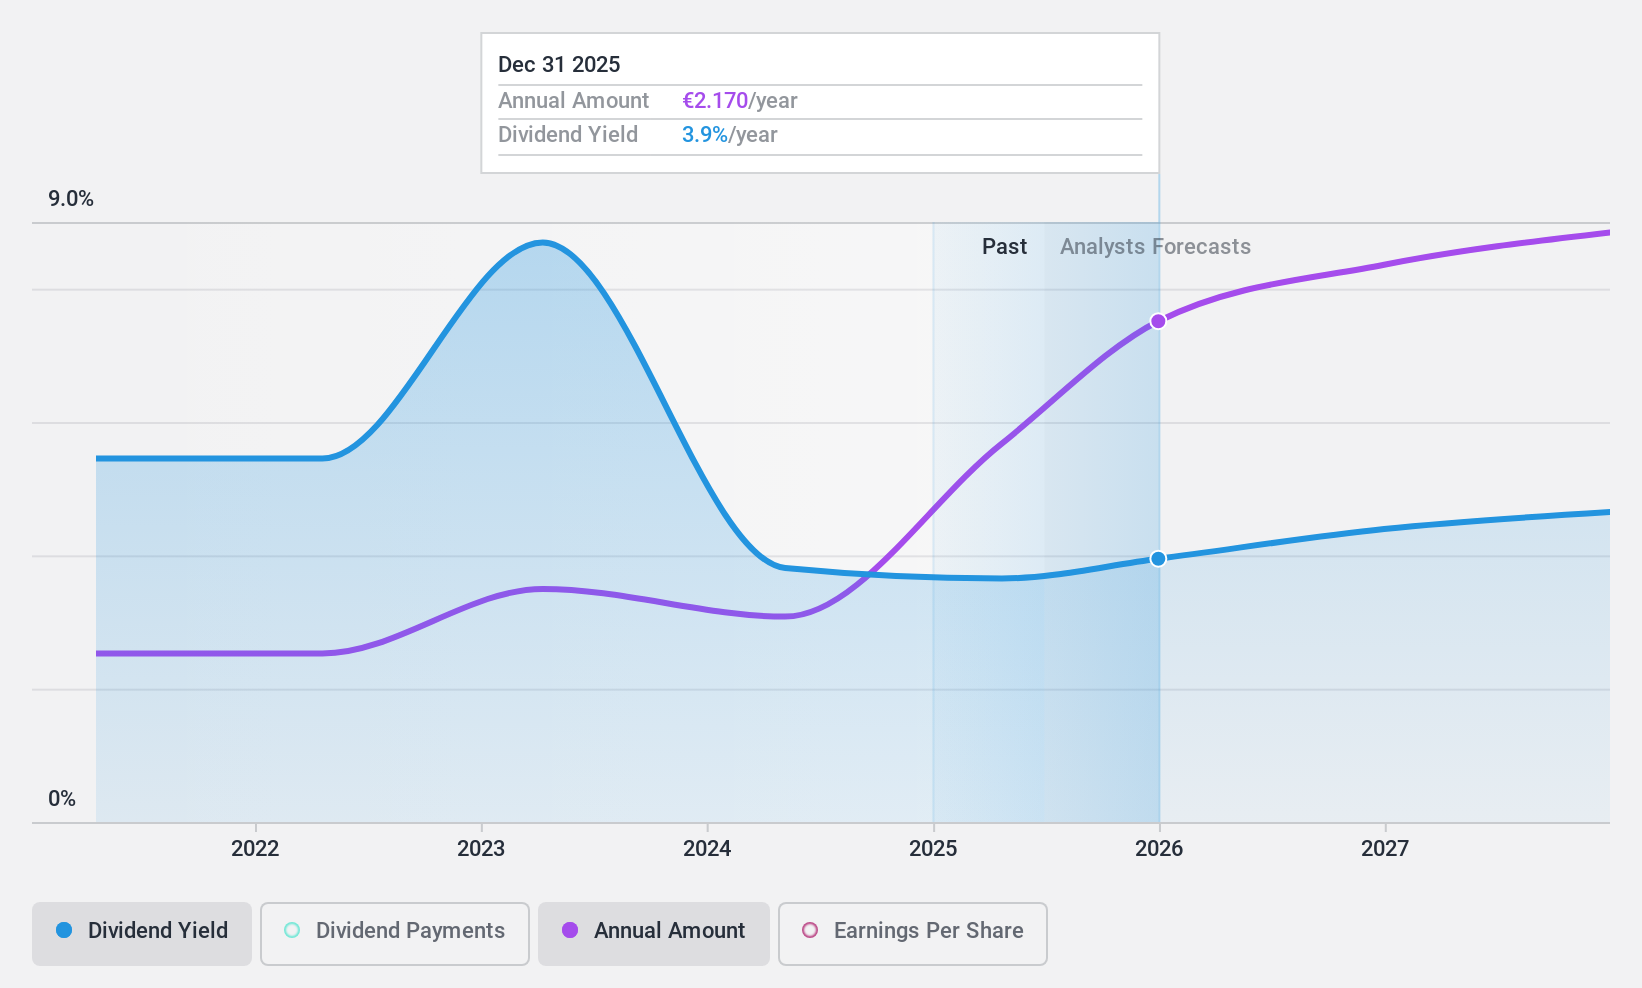
Dividend Yield: 3.7%
Koninklijke Heijmans has seen earnings growth of 65.5% over the past year, with dividends well covered by both earnings (payout ratio: 30%) and cash flows (cash payout ratio: 20.7%). However, its dividend payments have been volatile and unreliable over the past decade. Recent H1 2024 results showed a significant increase in net income to €37 million from €18 million last year, but shareholders experienced dilution during this period.
- Unlock comprehensive insights into our analysis of Koninklijke Heijmans stock in this dividend report.
- Our comprehensive valuation report raises the possibility that Koninklijke Heijmans is priced lower than what may be justified by its financials.
ING Groep (ENXTAM:INGA)
Simply Wall St Dividend Rating: ★★★★☆☆
Overview: ING Groep N.V. offers a range of banking products and services across the Netherlands, Belgium, Germany, the rest of Europe, and internationally, with a market cap of €51.57 billion.
Operations: ING Groep N.V.'s revenue segments include Retail Banking Netherlands (€4.97 billion), Retail Banking Belgium (€2.61 billion), Retail Banking Germany (€2.97 billion), and Wholesale Banking (€6.69 billion).
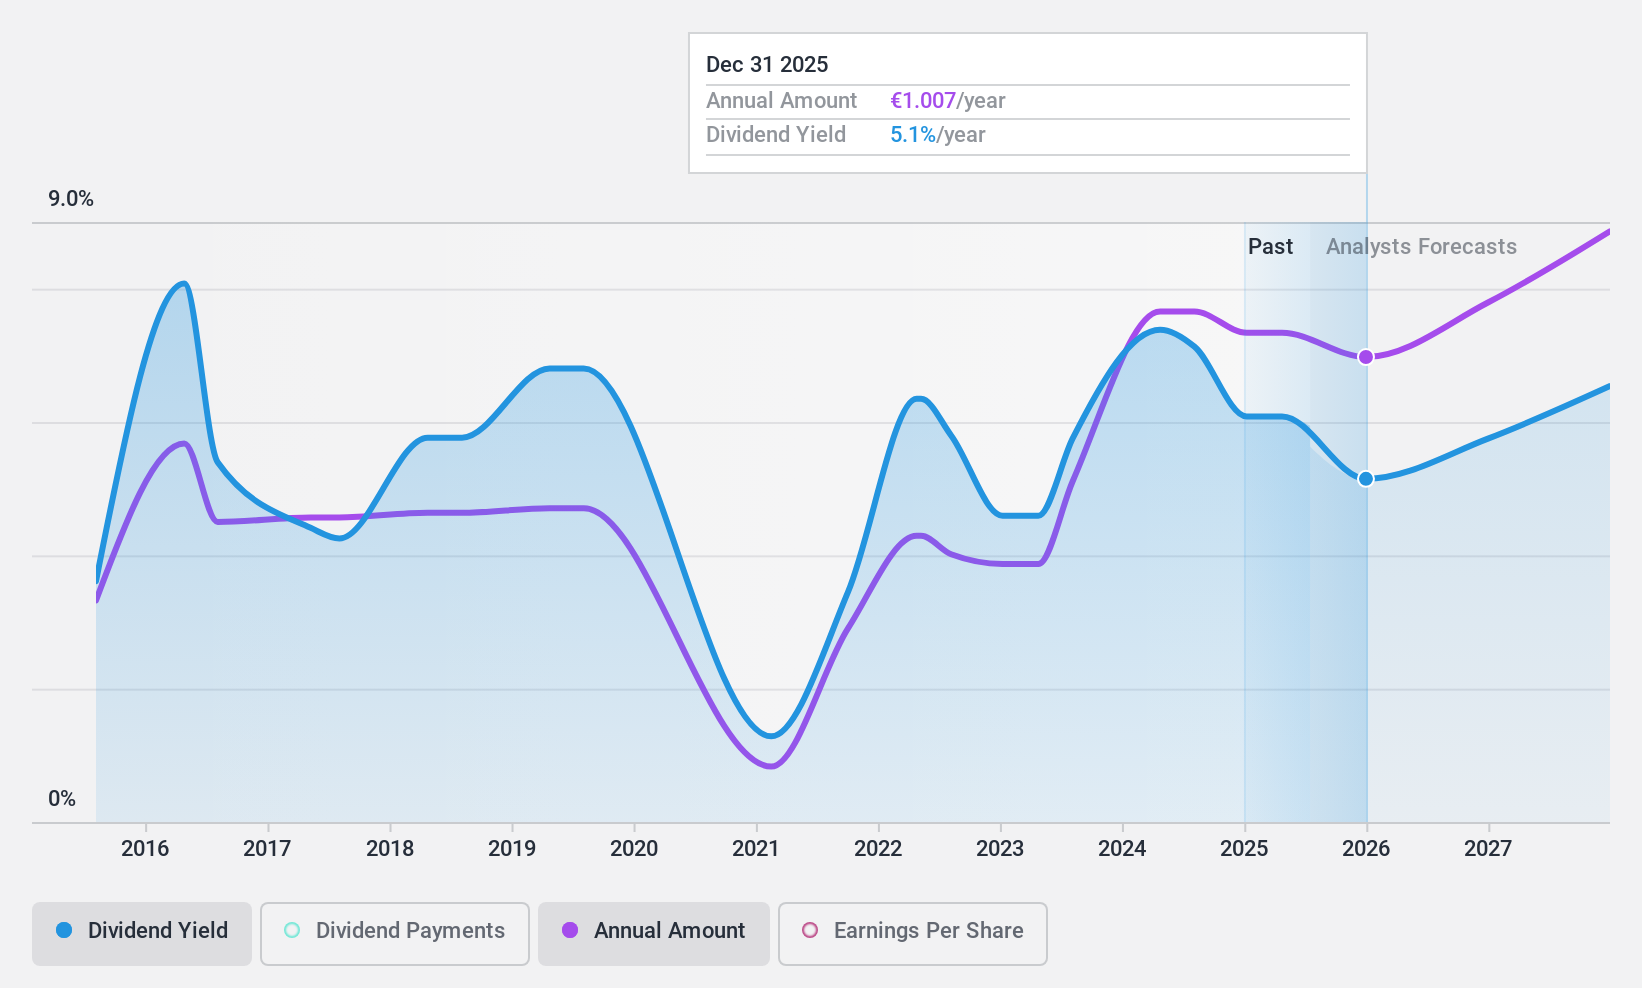
Dividend Yield: 6.8%
ING Groep's recent earnings showed a decline, with net income for Q2 2024 at €1.78 billion compared to €2.16 billion a year ago. Despite this, the company affirmed an interim dividend of €0.35 per share for H1 2024, maintaining its payout ratio at 69.8%. Although ING's dividends have been volatile over the past nine years, they are currently covered by earnings and forecasted to remain so in three years with a payout ratio of 50.7%.
- Get an in-depth perspective on ING Groep's performance by reading our dividend report here.
- Upon reviewing our latest valuation report, ING Groep's share price might be too pessimistic.
Make It Happen
- Unlock more gems! Our Top Euronext Amsterdam Dividend Stocks screener has unearthed 4 more companies for you to explore.Click here to unveil our expertly curated list of 7 Top Euronext Amsterdam Dividend Stocks.
- Are any of these part of your asset mix? Tap into the analytical power of Simply Wall St's portfolio to get a 360-degree view on how they're shaping up.
- Discover a world of investment opportunities with Simply Wall St's free app and access unparalleled stock analysis across all markets.
Seeking Other Investments?
- Explore high-performing small cap companies that haven't yet garnered significant analyst attention.
- Fuel your portfolio with companies showing strong growth potential, backed by optimistic outlooks both from analysts and management.
- Find companies with promising cash flow potential yet trading below their fair value.
This article by Simply Wall St is general in nature. We provide commentary based on historical data and analyst forecasts only using an unbiased methodology and our articles are not intended to be financial advice. It does not constitute a recommendation to buy or sell any stock, and does not take account of your objectives, or your financial situation. We aim to bring you long-term focused analysis driven by fundamental data. Note that our analysis may not factor in the latest price-sensitive company announcements or qualitative material. Simply Wall St has no position in any stocks mentioned.
New: Manage All Your Stock Portfolios in One Place
We've created the ultimate portfolio companion for stock investors, and it's free.
• Connect an unlimited number of Portfolios and see your total in one currency
• Be alerted to new Warning Signs or Risks via email or mobile
• Track the Fair Value of your stocks
Have feedback on this article? Concerned about the content? Get in touch with us directly. Alternatively, email editorial-team@simplywallst.com
About ENXTAM:AALB
Aalberts
Offers mission-critical technologies for aerospace, automotive, building, and maritime sectors.
Very undervalued with flawless balance sheet and pays a dividend.
