Here's What's Concerning About Innity Corporation Berhad's (KLSE:INNITY) Returns On Capital


To avoid investing in a business that's in decline, there's a few financial metrics that can provide early indications of aging. Businesses in decline often have two underlying trends, firstly, a declining return on capital employed (ROCE) and a declining base of capital employed. This indicates to us that the business is not only shrinking the size of its net assets, but its returns are falling as well. Having said that, after a brief look, Innity Corporation Berhad (KLSE:INNITY) we aren't filled with optimism, but let's investigate further.
Understanding Return On Capital Employed (ROCE)
For those who don't know, ROCE is a measure of a company's yearly pre-tax profit (its return), relative to the capital employed in the business. The formula for this calculation on Innity Corporation Berhad is:
Return on Capital Employed = Earnings Before Interest and Tax (EBIT) ÷ (Total Assets - Current Liabilities)
0.13 = RM5.4m ÷ (RM84m - RM41m) (Based on the trailing twelve months to December 2021).
Thus, Innity Corporation Berhad has an ROCE of 13%. In absolute terms, that's a satisfactory return, but compared to the Media industry average of 8.9% it's much better.
View our latest analysis for Innity Corporation Berhad
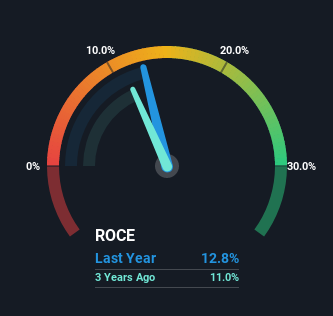
Historical performance is a great place to start when researching a stock so above you can see the gauge for Innity Corporation Berhad's ROCE against it's prior returns. If you'd like to look at how Innity Corporation Berhad has performed in the past in other metrics, you can view this free graph of past earnings, revenue and cash flow.
So How Is Innity Corporation Berhad's ROCE Trending?
There is reason to be cautious about Innity Corporation Berhad, given the returns are trending downwards. To be more specific, the ROCE was 17% five years ago, but since then it has dropped noticeably. Meanwhile, capital employed in the business has stayed roughly the flat over the period. Companies that exhibit these attributes tend to not be shrinking, but they can be mature and facing pressure on their margins from competition. If these trends continue, we wouldn't expect Innity Corporation Berhad to turn into a multi-bagger.
On a separate but related note, it's important to know that Innity Corporation Berhad has a current liabilities to total assets ratio of 49%, which we'd consider pretty high. This effectively means that suppliers (or short-term creditors) are funding a large portion of the business, so just be aware that this can introduce some elements of risk. Ideally we'd like to see this reduce as that would mean fewer obligations bearing risks.
Our Take On Innity Corporation Berhad's ROCE
All in all, the lower returns from the same amount of capital employed aren't exactly signs of a compounding machine. It should come as no surprise then that the stock has fallen 28% over the last five years, so it looks like investors are recognizing these changes. Unless there is a shift to a more positive trajectory in these metrics, we would look elsewhere.
Innity Corporation Berhad does have some risks though, and we've spotted 1 warning sign for Innity Corporation Berhad that you might be interested in.
While Innity Corporation Berhad may not currently earn the highest returns, we've compiled a list of companies that currently earn more than 25% return on equity. Check out this free list here.
New: AI Stock Screener & Alerts
Our new AI Stock Screener scans the market every day to uncover opportunities.
• Dividend Powerhouses (3%+ Yield)
• Undervalued Small Caps with Insider Buying
• High growth Tech and AI Companies
Or build your own from over 50 metrics.
Have feedback on this article? Concerned about the content? Get in touch with us directly. Alternatively, email editorial-team (at) simplywallst.com.
This article by Simply Wall St is general in nature. We provide commentary based on historical data and analyst forecasts only using an unbiased methodology and our articles are not intended to be financial advice. It does not constitute a recommendation to buy or sell any stock, and does not take account of your objectives, or your financial situation. We aim to bring you long-term focused analysis driven by fundamental data. Note that our analysis may not factor in the latest price-sensitive company announcements or qualitative material. Simply Wall St has no position in any stocks mentioned.
About KLSE:INNITY
Innity Corporation Berhad
An investment holding company, provides interactive online marketing platforms and data-driven technologies for advertisers and publishers.
Mediocre balance sheet low.
Similar Companies
Market Insights

Community Narratives


