
Advertisement
Calculating The Fair Value Of PETRONAS Chemicals Group Berhad (KLSE:PCHEM)

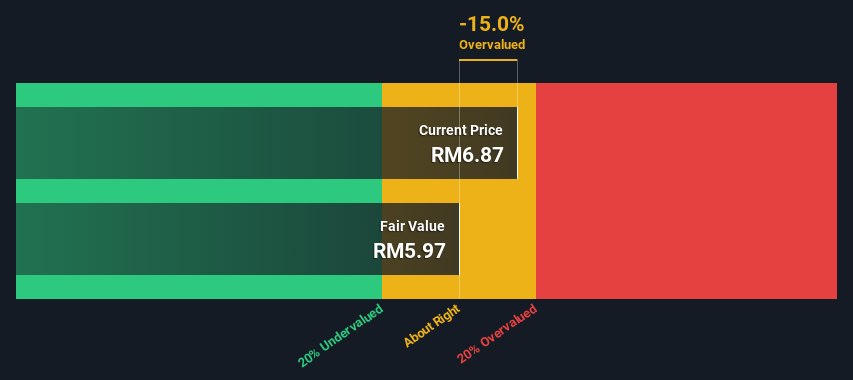
Key Insights
- The projected fair value for PETRONAS Chemicals Group Berhad is RM5.97 based on 2 Stage Free Cash Flow to Equity
- PETRONAS Chemicals Group Berhad's RM6.87 share price indicates it is trading at similar levels as its fair value estimate
- Our fair value estimate is 7.1% lower than PETRONAS Chemicals Group Berhad's analyst price target of RM6.43
In this article we are going to estimate the intrinsic value of PETRONAS Chemicals Group Berhad (KLSE:PCHEM) by projecting its future cash flows and then discounting them to today's value. We will use the Discounted Cash Flow (DCF) model on this occasion. It may sound complicated, but actually it is quite simple!
We would caution that there are many ways of valuing a company and, like the DCF, each technique has advantages and disadvantages in certain scenarios. If you still have some burning questions about this type of valuation, take a look at the Simply Wall St analysis model.
See our latest analysis for PETRONAS Chemicals Group Berhad
Step By Step Through The Calculation
We're using the 2-stage growth model, which simply means we take in account two stages of company's growth. In the initial period the company may have a higher growth rate and the second stage is usually assumed to have a stable growth rate. To start off with, we need to estimate the next ten years of cash flows. Where possible we use analyst estimates, but when these aren't available we extrapolate the previous free cash flow (FCF) from the last estimate or reported value. We assume companies with shrinking free cash flow will slow their rate of shrinkage, and that companies with growing free cash flow will see their growth rate slow, over this period. We do this to reflect that growth tends to slow more in the early years than it does in later years.
A DCF is all about the idea that a dollar in the future is less valuable than a dollar today, so we need to discount the sum of these future cash flows to arrive at a present value estimate:
10-year free cash flow (FCF) estimate
| 2024 | 2025 | 2026 | 2027 | 2028 | 2029 | 2030 | 2031 | 2032 | 2033 | |
| Levered FCF (MYR, Millions) | RM3.64b | RM4.08b | RM3.78b | RM3.63b | RM3.57b | RM3.57b | RM3.61b | RM3.67b | RM3.75b | RM3.85b |
| Growth Rate Estimate Source | Analyst x6 | Analyst x6 | Analyst x4 | Est @ -3.84% | Est @ -1.63% | Est @ -0.08% | Est @ 1.01% | Est @ 1.77% | Est @ 2.30% | Est @ 2.67% |
| Present Value (MYR, Millions) Discounted @ 9.8% | RM3.3k | RM3.4k | RM2.8k | RM2.5k | RM2.2k | RM2.0k | RM1.9k | RM1.7k | RM1.6k | RM1.5k |
("Est" = FCF growth rate estimated by Simply Wall St)
Present Value of 10-year Cash Flow (PVCF) = RM23b
The second stage is also known as Terminal Value, this is the business's cash flow after the first stage. The Gordon Growth formula is used to calculate Terminal Value at a future annual growth rate equal to the 5-year average of the 10-year government bond yield of 3.5%. We discount the terminal cash flows to today's value at a cost of equity of 9.8%.
Terminal Value (TV)= FCF2033 × (1 + g) ÷ (r – g) = RM3.9b× (1 + 3.5%) ÷ (9.8%– 3.5%) = RM63b
Present Value of Terminal Value (PVTV)= TV / (1 + r)10= RM63b÷ ( 1 + 9.8%)10= RM25b
The total value is the sum of cash flows for the next ten years plus the discounted terminal value, which results in the Total Equity Value, which in this case is RM48b. The last step is to then divide the equity value by the number of shares outstanding. Compared to the current share price of RM6.9, the company appears around fair value at the time of writing. Remember though, that this is just an approximate valuation, and like any complex formula - garbage in, garbage out.
Important Assumptions
The calculation above is very dependent on two assumptions. The first is the discount rate and the other is the cash flows. You don't have to agree with these inputs, I recommend redoing the calculations yourself and playing with them. The DCF also does not consider the possible cyclicality of an industry, or a company's future capital requirements, so it does not give a full picture of a company's potential performance. Given that we are looking at PETRONAS Chemicals Group Berhad as potential shareholders, the cost of equity is used as the discount rate, rather than the cost of capital (or weighted average cost of capital, WACC) which accounts for debt. In this calculation we've used 9.8%, which is based on a levered beta of 0.993. Beta is a measure of a stock's volatility, compared to the market as a whole. We get our beta from the industry average beta of globally comparable companies, with an imposed limit between 0.8 and 2.0, which is a reasonable range for a stable business.
SWOT Analysis for PETRONAS Chemicals Group Berhad
Strength
- Debt is not viewed as a risk.
- Dividends are covered by earnings and cash flows.
Weakness
- Earnings declined over the past year.
- Dividend is low compared to the top 25% of dividend payers in the Chemicals market.
- Expensive based on P/E ratio and estimated fair value.
Opportunity
- Annual earnings are forecast to grow faster than the Malaysian market.
Threat
- Annual revenue is forecast to grow slower than the Malaysian market.
Looking Ahead:
Whilst important, the DCF calculation shouldn't be the only metric you look at when researching a company. DCF models are not the be-all and end-all of investment valuation. Rather it should be seen as a guide to "what assumptions need to be true for this stock to be under/overvalued?" For example, changes in the company's cost of equity or the risk free rate can significantly impact the valuation. For PETRONAS Chemicals Group Berhad, we've compiled three essential aspects you should further research:
- Risks: We feel that you should assess the 1 warning sign for PETRONAS Chemicals Group Berhad we've flagged before making an investment in the company.
- Future Earnings: How does PCHEM's growth rate compare to its peers and the wider market? Dig deeper into the analyst consensus number for the upcoming years by interacting with our free analyst growth expectation chart.
- Other High Quality Alternatives: Do you like a good all-rounder? Explore our interactive list of high quality stocks to get an idea of what else is out there you may be missing!
PS. The Simply Wall St app conducts a discounted cash flow valuation for every stock on the KLSE every day. If you want to find the calculation for other stocks just search here.
New: Manage All Your Stock Portfolios in One Place
We've created the ultimate portfolio companion for stock investors, and it's free.
• Connect an unlimited number of Portfolios and see your total in one currency
• Be alerted to new Warning Signs or Risks via email or mobile
• Track the Fair Value of your stocks
Have feedback on this article? Concerned about the content? Get in touch with us directly. Alternatively, email editorial-team (at) simplywallst.com.
This article by Simply Wall St is general in nature. We provide commentary based on historical data and analyst forecasts only using an unbiased methodology and our articles are not intended to be financial advice. It does not constitute a recommendation to buy or sell any stock, and does not take account of your objectives, or your financial situation. We aim to bring you long-term focused analysis driven by fundamental data. Note that our analysis may not factor in the latest price-sensitive company announcements or qualitative material. Simply Wall St has no position in any stocks mentioned.
About KLSE:PCHEM
PETRONAS Chemicals Group Berhad
An investment holding company, engages in production and sale of chemicals.
Excellent balance sheet with moderate growth potential.
Market Insights

Advertisement
Community Narratives
Pinterest will surge as advertising innovations ignite revenue growth
Fair Value US$42.63|26.3% undervalued
BR
Community Contributor
Brambles' Revenue Set to Climb 14% with Profit Margins Following
Fair Value AU$21.90|4.9% overvalued
RO
Community Contributor
Challenging Future for STG as Organic Sales Decline by 8.8%
Fair Value DKK 116.13|26.8% undervalued
KA
Community Contributor