
Advertisement
Market Cool On Asia Poly Holdings Berhad's (KLSE:ASIAPLY) Revenues Pushing Shares 35% Lower

Asia Poly Holdings Berhad (KLSE:ASIAPLY) shares have retraced a considerable 35% in the last month, reversing a fair amount of their solid recent performance. Instead of being rewarded, shareholders who have already held through the last twelve months are now sitting on a 21% share price drop.
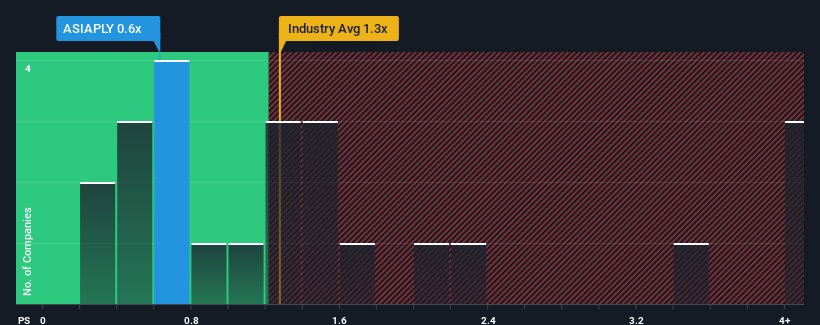
Following the heavy fall in price, considering around half the companies operating in Malaysia's Chemicals industry have price-to-sales ratios (or "P/S") above 1.3x, you may consider Asia Poly Holdings Berhad as an solid investment opportunity with its 0.6x P/S ratio. However, the P/S might be low for a reason and it requires further investigation to determine if it's justified.
See our latest analysis for Asia Poly Holdings Berhad
What Does Asia Poly Holdings Berhad's P/S Mean For Shareholders?
Revenue has risen firmly for Asia Poly Holdings Berhad recently, which is pleasing to see. It might be that many expect the respectable revenue performance to degrade substantially, which has repressed the P/S. If you like the company, you'd be hoping this isn't the case so that you could potentially pick up some stock while it's out of favour.
Although there are no analyst estimates available for Asia Poly Holdings Berhad, take a look at this free data-rich visualisation to see how the company stacks up on earnings, revenue and cash flow.How Is Asia Poly Holdings Berhad's Revenue Growth Trending?
There's an inherent assumption that a company should underperform the industry for P/S ratios like Asia Poly Holdings Berhad's to be considered reasonable.
Taking a look back first, we see that the company grew revenue by an impressive 17% last year. As a result, it also grew revenue by 29% in total over the last three years. Therefore, it's fair to say the revenue growth recently has been respectable for the company.
Weighing that recent medium-term revenue trajectory against the broader industry's one-year forecast for expansion of 8.2% shows it's about the same on an annualised basis.
In light of this, it's peculiar that Asia Poly Holdings Berhad's P/S sits below the majority of other companies. It may be that most investors are not convinced the company can maintain recent growth rates.
The Key Takeaway
Asia Poly Holdings Berhad's recently weak share price has pulled its P/S back below other Chemicals companies. We'd say the price-to-sales ratio's power isn't primarily as a valuation instrument but rather to gauge current investor sentiment and future expectations.
Our examination of Asia Poly Holdings Berhad revealed its three-year revenue trends looking similar to current industry expectations hasn't given the P/S the boost we expected, given that it's lower than the wider industry P/S, There could be some unobserved threats to revenue preventing the P/S ratio from matching the company's performance. medium-term
You should always think about risks. Case in point, we've spotted 3 warning signs for Asia Poly Holdings Berhad you should be aware of, and 2 of them are concerning.
If companies with solid past earnings growth is up your alley, you may wish to see this free collection of other companies with strong earnings growth and low P/E ratios.
New: Manage All Your Stock Portfolios in One Place
We've created the ultimate portfolio companion for stock investors, and it's free.
• Connect an unlimited number of Portfolios and see your total in one currency
• Be alerted to new Warning Signs or Risks via email or mobile
• Track the Fair Value of your stocks
Have feedback on this article? Concerned about the content? Get in touch with us directly. Alternatively, email editorial-team (at) simplywallst.com.
This article by Simply Wall St is general in nature. We provide commentary based on historical data and analyst forecasts only using an unbiased methodology and our articles are not intended to be financial advice. It does not constitute a recommendation to buy or sell any stock, and does not take account of your objectives, or your financial situation. We aim to bring you long-term focused analysis driven by fundamental data. Note that our analysis may not factor in the latest price-sensitive company announcements or qualitative material. Simply Wall St has no position in any stocks mentioned.
Have feedback on this article? Concerned about the content? Get in touch with us directly. Alternatively, email editorial-team@simplywallst.com
About KLSE:ASIAPLY
Asia Poly Holdings Berhad
An investment holding company, manufactures and sells cell cast acrylic sheets.
Adequate balance sheet low.
Market Insights

Advertisement
Community Narratives
Pole position to benefit from GENIUS Act
Fair Value US$233.04|58.8% undervalued
CH
Community Contributor
IREN will transform from bitcoin miner to leader in AI infrastructure
Fair Value US$21.48|11.6% undervalued
KA
Community Contributor
Behind the Assay: XRF Scientific’s Role in Modern Mining Economics
Fair Value AU$2.10|0% overvalued
RO
Community Contributor