
If you're looking for a multi-bagger, there's a few things to keep an eye out for. Ideally, a business will show two trends; firstly a growing return on capital employed (ROCE) and secondly, an increasing amount of capital employed. Ultimately, this demonstrates that it's a business that is reinvesting profits at increasing rates of return. Speaking of which, we noticed some great changes in A-Rank Berhad's (KLSE:ARANK) returns on capital, so let's have a look.
Return On Capital Employed (ROCE): What Is It?
For those that aren't sure what ROCE is, it measures the amount of pre-tax profits a company can generate from the capital employed in its business. Analysts use this formula to calculate it for A-Rank Berhad:
Return on Capital Employed = Earnings Before Interest and Tax (EBIT) ÷ (Total Assets - Current Liabilities)
0.086 = RM18m ÷ (RM352m - RM143m) (Based on the trailing twelve months to April 2025).
Therefore, A-Rank Berhad has an ROCE of 8.6%. In absolute terms, that's a low return but it's around the Metals and Mining industry average of 7.6%.
View our latest analysis for A-Rank Berhad
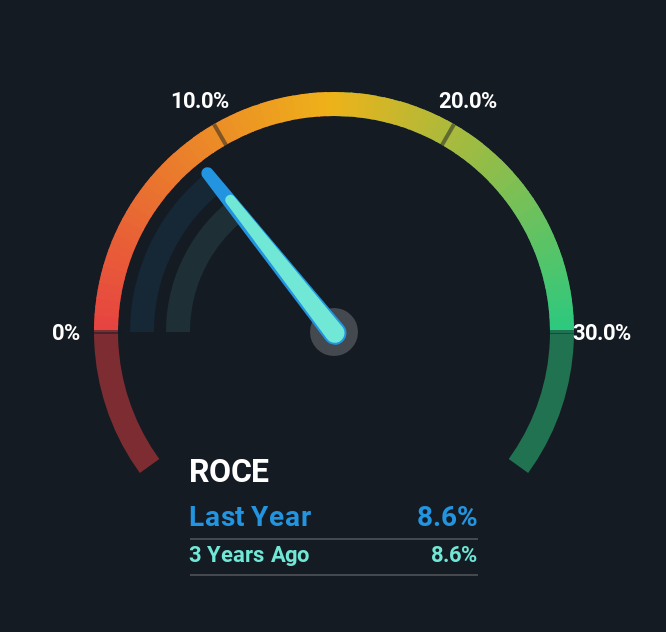
While the past is not representative of the future, it can be helpful to know how a company has performed historically, which is why we have this chart above. If you want to delve into the historical earnings , check out these free graphs detailing revenue and cash flow performance of A-Rank Berhad.
So How Is A-Rank Berhad's ROCE Trending?
While in absolute terms it isn't a high ROCE, it's promising to see that it has been moving in the right direction. Over the last five years, returns on capital employed have risen substantially to 8.6%. The company is effectively making more money per dollar of capital used, and it's worth noting that the amount of capital has increased too, by 48%. The increasing returns on a growing amount of capital is common amongst multi-baggers and that's why we're impressed.
On a separate but related note, it's important to know that A-Rank Berhad has a current liabilities to total assets ratio of 41%, which we'd consider pretty high. This can bring about some risks because the company is basically operating with a rather large reliance on its suppliers or other sorts of short-term creditors. Ideally we'd like to see this reduce as that would mean fewer obligations bearing risks.
In Conclusion...
A company that is growing its returns on capital and can consistently reinvest in itself is a highly sought after trait, and that's what A-Rank Berhad has. Since the stock has only returned 39% to shareholders over the last five years, the promising fundamentals may not be recognized yet by investors. Given that, we'd look further into this stock in case it has more traits that could make it multiply in the long term.
On a final note, we found 4 warning signs for A-Rank Berhad (2 can't be ignored) you should be aware of.
While A-Rank Berhad isn't earning the highest return, check out this free list of companies that are earning high returns on equity with solid balance sheets.
Mobile Infrastructure for Defense and Disaster
The next wave in robotics isn't humanoid. Its fully autonomous towers delivering 5G, ISR, and radar in under 30 minutes, anywhere.
Get the investor briefing before the next round of contracts
Sponsored On Behalf of CiTechNew: Manage All Your Stock Portfolios in One Place
We've created the ultimate portfolio companion for stock investors, and it's free.
• Connect an unlimited number of Portfolios and see your total in one currency
• Be alerted to new Warning Signs or Risks via email or mobile
• Track the Fair Value of your stocks
Have feedback on this article? Concerned about the content? Get in touch with us directly. Alternatively, email editorial-team (at) simplywallst.com.
This article by Simply Wall St is general in nature. We provide commentary based on historical data and analyst forecasts only using an unbiased methodology and our articles are not intended to be financial advice. It does not constitute a recommendation to buy or sell any stock, and does not take account of your objectives, or your financial situation. We aim to bring you long-term focused analysis driven by fundamental data. Note that our analysis may not factor in the latest price-sensitive company announcements or qualitative material. Simply Wall St has no position in any stocks mentioned.
About KLSE:ARANK
A-Rank Berhad
An investment holding company, manufactures and markets aluminium billets in Malaysia.
Excellent balance sheet established dividend payer.
Market Insights

Weekly Picks

THE KINGDOM OF BROWN GOODS: WHY MGPI IS BEING CRUSHED BY INVENTORY & PRIMED FOR RESURRECTION


Why Vertical Aerospace (NYSE: EVTL) is Worth Possibly Over 13x its Current Price


The Quiet Giant That Became AI’s Power Grid
Recently Updated Narratives
Why Vertical Aerospace (NYSE: EVTL) is Worth Possibly Over 13x its Current Price

Deep Value Multi Bagger Opportunity


A case for CA$31.80 (undiluted), aka 8,616% upside from CA$0.37 (an 86 bagger!).
Popular Narratives


MicroVision will explode future revenue by 380.37% with a vision towards success


NVDA: Expanding AI Demand Will Drive Major Data Center Investments Through 2026


Crazy Undervalued 42 Baggers Silver Play (Active & Running Mine)
Trending Discussion


