
Advertisement

Key Insights
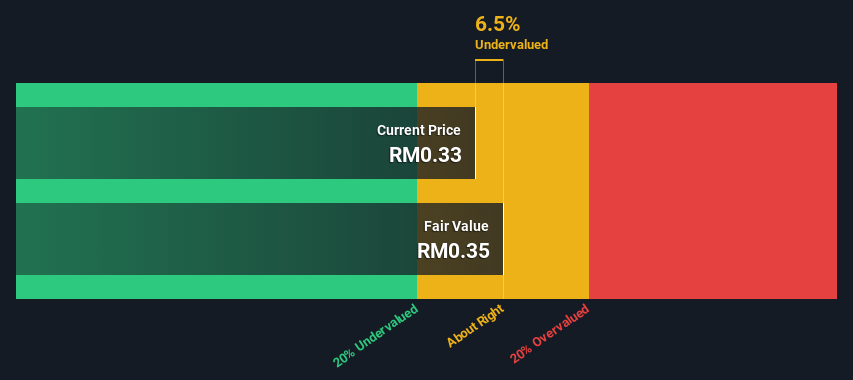
- Using the 2 Stage Free Cash Flow to Equity, Paos Holdings Berhad fair value estimate is RM0.35
- With RM0.33 share price, Paos Holdings Berhad appears to be trading close to its estimated fair value
- Peers of Paos Holdings Berhad are currently trading on average at a 51% premium
Today we will run through one way of estimating the intrinsic value of Paos Holdings Berhad (KLSE:PAOS) by projecting its future cash flows and then discounting them to today's value. We will take advantage of the Discounted Cash Flow (DCF) model for this purpose. Believe it or not, it's not too difficult to follow, as you'll see from our example!
Remember though, that there are many ways to estimate a company's value, and a DCF is just one method. If you still have some burning questions about this type of valuation, take a look at the Simply Wall St analysis model.
Check out our latest analysis for Paos Holdings Berhad
What's The Estimated Valuation?
We are going to use a two-stage DCF model, which, as the name states, takes into account two stages of growth. The first stage is generally a higher growth period which levels off heading towards the terminal value, captured in the second 'steady growth' period. To start off with, we need to estimate the next ten years of cash flows. Seeing as no analyst estimates of free cash flow are available to us, we have extrapolate the previous free cash flow (FCF) from the company's last reported value. We assume companies with shrinking free cash flow will slow their rate of shrinkage, and that companies with growing free cash flow will see their growth rate slow, over this period. We do this to reflect that growth tends to slow more in the early years than it does in later years.
Generally we assume that a dollar today is more valuable than a dollar in the future, and so the sum of these future cash flows is then discounted to today's value:
10-year free cash flow (FCF) estimate
| 2024 | 2025 | 2026 | 2027 | 2028 | 2029 | 2030 | 2031 | 2032 | 2033 | |
| Levered FCF (MYR, Millions) | RM3.09m | RM3.32m | RM3.54m | RM3.73m | RM3.91m | RM4.09m | RM4.26m | RM4.44m | RM4.61m | RM4.78m |
| Growth Rate Estimate Source | Est @ 9.28% | Est @ 7.56% | Est @ 6.36% | Est @ 5.52% | Est @ 4.93% | Est @ 4.51% | Est @ 4.22% | Est @ 4.02% | Est @ 3.88% | Est @ 3.78% |
| Present Value (MYR, Millions) Discounted @ 9.0% | RM2.8 | RM2.8 | RM2.7 | RM2.6 | RM2.5 | RM2.4 | RM2.3 | RM2.2 | RM2.1 | RM2.0 |
("Est" = FCF growth rate estimated by Simply Wall St)
Present Value of 10-year Cash Flow (PVCF) = RM25m
After calculating the present value of future cash flows in the initial 10-year period, we need to calculate the Terminal Value, which accounts for all future cash flows beyond the first stage. The Gordon Growth formula is used to calculate Terminal Value at a future annual growth rate equal to the 5-year average of the 10-year government bond yield of 3.6%. We discount the terminal cash flows to today's value at a cost of equity of 9.0%.
Terminal Value (TV)= FCF2033 × (1 + g) ÷ (r – g) = RM4.8m× (1 + 3.6%) ÷ (9.0%– 3.6%) = RM91m
Present Value of Terminal Value (PVTV)= TV / (1 + r)10= RM91m÷ ( 1 + 9.0%)10= RM38m
The total value is the sum of cash flows for the next ten years plus the discounted terminal value, which results in the Total Equity Value, which in this case is RM63m. The last step is to then divide the equity value by the number of shares outstanding. Relative to the current share price of RM0.3, the company appears about fair value at a 6.5% discount to where the stock price trades currently. Valuations are imprecise instruments though, rather like a telescope - move a few degrees and end up in a different galaxy. Do keep this in mind.
The Assumptions
Now the most important inputs to a discounted cash flow are the discount rate, and of course, the actual cash flows. If you don't agree with these result, have a go at the calculation yourself and play with the assumptions. The DCF also does not consider the possible cyclicality of an industry, or a company's future capital requirements, so it does not give a full picture of a company's potential performance. Given that we are looking at Paos Holdings Berhad as potential shareholders, the cost of equity is used as the discount rate, rather than the cost of capital (or weighted average cost of capital, WACC) which accounts for debt. In this calculation we've used 9.0%, which is based on a levered beta of 0.800. Beta is a measure of a stock's volatility, compared to the market as a whole. We get our beta from the industry average beta of globally comparable companies, with an imposed limit between 0.8 and 2.0, which is a reasonable range for a stable business.
Next Steps:
Although the valuation of a company is important, it shouldn't be the only metric you look at when researching a company. The DCF model is not a perfect stock valuation tool. Rather it should be seen as a guide to "what assumptions need to be true for this stock to be under/overvalued?" If a company grows at a different rate, or if its cost of equity or risk free rate changes sharply, the output can look very different. For Paos Holdings Berhad, we've compiled three pertinent items you should consider:
- Risks: Take risks, for example - Paos Holdings Berhad has 3 warning signs (and 1 which doesn't sit too well with us) we think you should know about.
- Other High Quality Alternatives: Do you like a good all-rounder? Explore our interactive list of high quality stocks to get an idea of what else is out there you may be missing!
- Other Environmentally-Friendly Companies: Concerned about the environment and think consumers will buy eco-friendly products more and more? Browse through our interactive list of companies that are thinking about a greener future to discover some stocks you may not have thought of!
PS. The Simply Wall St app conducts a discounted cash flow valuation for every stock on the KLSE every day. If you want to find the calculation for other stocks just search here.
New: Manage All Your Stock Portfolios in One Place
We've created the ultimate portfolio companion for stock investors, and it's free.
• Connect an unlimited number of Portfolios and see your total in one currency
• Be alerted to new Warning Signs or Risks via email or mobile
• Track the Fair Value of your stocks
Have feedback on this article? Concerned about the content? Get in touch with us directly. Alternatively, email editorial-team (at) simplywallst.com.
This article by Simply Wall St is general in nature. We provide commentary based on historical data and analyst forecasts only using an unbiased methodology and our articles are not intended to be financial advice. It does not constitute a recommendation to buy or sell any stock, and does not take account of your objectives, or your financial situation. We aim to bring you long-term focused analysis driven by fundamental data. Note that our analysis may not factor in the latest price-sensitive company announcements or qualitative material. Simply Wall St has no position in any stocks mentioned.
About KLSE:PAOS
Paos Holdings Berhad
An investment holding company, manufactures and deals in soaps and its related products in Malaysia, South East Asia, and internationally.
Flawless balance sheet and slightly overvalued.
Market Insights


Advertisement
Community Narratives
Gaxos.ai: Early-Stage AI Innovator in Gaming & Health
Fair Value US$2.21|5.9% undervalued
JO
Community Contributor
After the AI Party: A Sobering Look at Microsoft's Future
Fair Value US$500.00|1.4% overvalued
PI
Community Contributor
Amazon's Future Rises as Stock Price Falls: A Long-Term Investment Vision
Fair Value US$234.75|2.5% undervalued
ZW
Community Contributor
