
Advertisement
- Malaysia
- /
- Personal Products
- /
- KLSE:BIOHLDG
Lacklustre Performance Is Driving Bioalpha Holdings Berhad's (KLSE:BIOHLDG) 33% Price Drop

Unfortunately for some shareholders, the Bioalpha Holdings Berhad (KLSE:BIOHLDG) share price has dived 33% in the last thirty days, prolonging recent pain. For any long-term shareholders, the last month ends a year to forget by locking in a 65% share price decline.
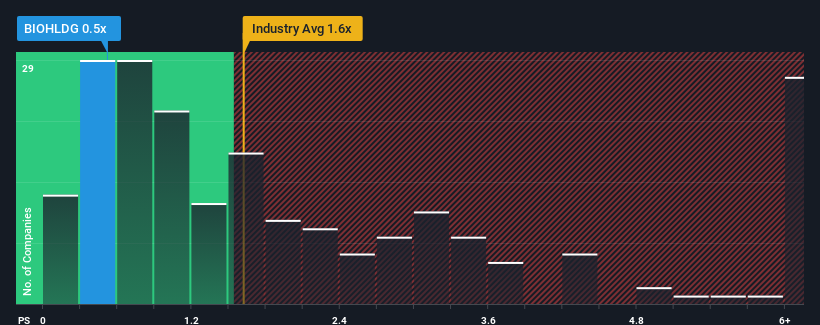
Following the heavy fall in price, when close to half the companies operating in Malaysia's Personal Products industry have price-to-sales ratios (or "P/S") above 1.4x, you may consider Bioalpha Holdings Berhad as an enticing stock to check out with its 0.5x P/S ratio. Nonetheless, we'd need to dig a little deeper to determine if there is a rational basis for the reduced P/S.
Our free stock report includes 3 warning signs investors should be aware of before investing in Bioalpha Holdings Berhad. Read for free now.View our latest analysis for Bioalpha Holdings Berhad
What Does Bioalpha Holdings Berhad's P/S Mean For Shareholders?
Bioalpha Holdings Berhad certainly has been doing a great job lately as it's been growing its revenue at a really rapid pace. Perhaps the market is expecting future revenue performance to dwindle, which has kept the P/S suppressed. Those who are bullish on Bioalpha Holdings Berhad will be hoping that this isn't the case, so that they can pick up the stock at a lower valuation.
Although there are no analyst estimates available for Bioalpha Holdings Berhad, take a look at this free data-rich visualisation to see how the company stacks up on earnings, revenue and cash flow.How Is Bioalpha Holdings Berhad's Revenue Growth Trending?
There's an inherent assumption that a company should underperform the industry for P/S ratios like Bioalpha Holdings Berhad's to be considered reasonable.
Taking a look back first, we see that the company grew revenue by an impressive 77% last year. Still, revenue has fallen 16% in total from three years ago, which is quite disappointing. So unfortunately, we have to acknowledge that the company has not done a great job of growing revenues over that time.
Comparing that to the industry, which is predicted to deliver 9.7% growth in the next 12 months, the company's downward momentum based on recent medium-term revenue results is a sobering picture.
With this information, we are not surprised that Bioalpha Holdings Berhad is trading at a P/S lower than the industry. Nonetheless, there's no guarantee the P/S has reached a floor yet with revenue going in reverse. Even just maintaining these prices could be difficult to achieve as recent revenue trends are already weighing down the shares.
What We Can Learn From Bioalpha Holdings Berhad's P/S?
Bioalpha Holdings Berhad's P/S has taken a dip along with its share price. It's argued the price-to-sales ratio is an inferior measure of value within certain industries, but it can be a powerful business sentiment indicator.
Our examination of Bioalpha Holdings Berhad confirms that the company's shrinking revenue over the past medium-term is a key factor in its low price-to-sales ratio, given the industry is projected to grow. At this stage investors feel the potential for an improvement in revenue isn't great enough to justify a higher P/S ratio. Given the current circumstances, it seems unlikely that the share price will experience any significant movement in either direction in the near future if recent medium-term revenue trends persist.
Having said that, be aware Bioalpha Holdings Berhad is showing 3 warning signs in our investment analysis, you should know about.
If these risks are making you reconsider your opinion on Bioalpha Holdings Berhad, explore our interactive list of high quality stocks to get an idea of what else is out there.
Valuation is complex, but we're here to simplify it.
Discover if Bioalpha Holdings Berhad might be undervalued or overvalued with our detailed analysis, featuring fair value estimates, potential risks, dividends, insider trades, and its financial condition.
Access Free AnalysisHave feedback on this article? Concerned about the content? Get in touch with us directly. Alternatively, email editorial-team (at) simplywallst.com.
This article by Simply Wall St is general in nature. We provide commentary based on historical data and analyst forecasts only using an unbiased methodology and our articles are not intended to be financial advice. It does not constitute a recommendation to buy or sell any stock, and does not take account of your objectives, or your financial situation. We aim to bring you long-term focused analysis driven by fundamental data. Note that our analysis may not factor in the latest price-sensitive company announcements or qualitative material. Simply Wall St has no position in any stocks mentioned.
About KLSE:BIOHLDG
Bioalpha Holdings Berhad
An investment holding company, manufactures and sells health supplement products in Malaysia, China, and internationally.
Flawless balance sheet low.
Similar Companies
Market Insights

Advertisement
Community Narratives
Pinterest will surge as advertising innovations ignite revenue growth
Fair Value US$42.63|26.1% undervalued
BR
Community Contributor
Brambles' Revenue Set to Climb 14% with Profit Margins Following
Fair Value AU$21.90|4.8% overvalued
RO
Community Contributor
Challenging Future for STG as Organic Sales Decline by 8.8%
Fair Value DKK 116.13|26.8% undervalued
KA
Community Contributor