
Advertisement
- Malaysia
- /
- Healthcare Services
- /
- KLSE:G3
A Piece Of The Puzzle Missing From G3 Global Berhad's (KLSE:G3) 33% Share Price Climb
The G3 Global Berhad (KLSE:G3) share price has done very well over the last month, posting an excellent gain of 33%. Unfortunately, the gains of the last month did little to right the losses of the last year with the stock still down 20% over that time.
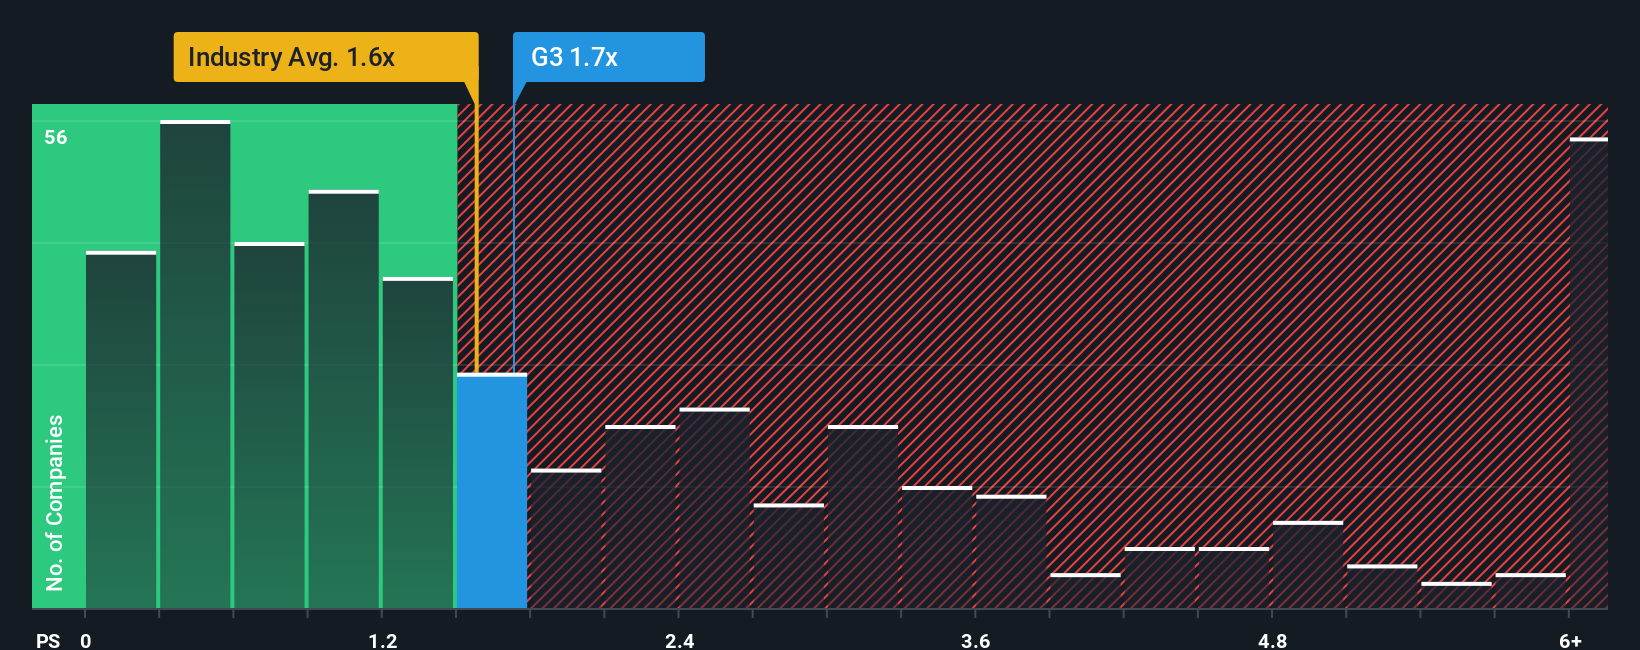
In spite of the firm bounce in price, considering around half the companies operating in Malaysia's Healthcare industry have price-to-sales ratios (or "P/S") above 2.4x, you may still consider G3 Global Berhad as an solid investment opportunity with its 1.7x P/S ratio. Nonetheless, we'd need to dig a little deeper to determine if there is a rational basis for the reduced P/S.
Check out our latest analysis for G3 Global Berhad
How Has G3 Global Berhad Performed Recently?
For example, consider that G3 Global Berhad's financial performance has been poor lately as its revenue has been in decline. One possibility is that the P/S is low because investors think the company won't do enough to avoid underperforming the broader industry in the near future. Those who are bullish on G3 Global Berhad will be hoping that this isn't the case so that they can pick up the stock at a lower valuation.
We don't have analyst forecasts, but you can see how recent trends are setting up the company for the future by checking out our free report on G3 Global Berhad's earnings, revenue and cash flow.How Is G3 Global Berhad's Revenue Growth Trending?
The only time you'd be truly comfortable seeing a P/S as low as G3 Global Berhad's is when the company's growth is on track to lag the industry.
In reviewing the last year of financials, we were disheartened to see the company's revenues fell to the tune of 14%. However, a few very strong years before that means that it was still able to grow revenue by an impressive 49% in total over the last three years. Accordingly, while they would have preferred to keep the run going, shareholders would definitely welcome the medium-term rates of revenue growth.
Comparing that to the industry, which is only predicted to deliver 9.1% growth in the next 12 months, the company's momentum is stronger based on recent medium-term annualised revenue results.
With this information, we find it odd that G3 Global Berhad is trading at a P/S lower than the industry. Apparently some shareholders believe the recent performance has exceeded its limits and have been accepting significantly lower selling prices.
What We Can Learn From G3 Global Berhad's P/S?
G3 Global Berhad's stock price has surged recently, but its but its P/S still remains modest. We'd say the price-to-sales ratio's power isn't primarily as a valuation instrument but rather to gauge current investor sentiment and future expectations.
We're very surprised to see G3 Global Berhad currently trading on a much lower than expected P/S since its recent three-year growth is higher than the wider industry forecast. When we see robust revenue growth that outpaces the industry, we presume that there are notable underlying risks to the company's future performance, which is exerting downward pressure on the P/S ratio. At least price risks look to be very low if recent medium-term revenue trends continue, but investors seem to think future revenue could see a lot of volatility.
Before you take the next step, you should know about the 2 warning signs for G3 Global Berhad (1 is concerning!) that we have uncovered.
Of course, profitable companies with a history of great earnings growth are generally safer bets. So you may wish to see this free collection of other companies that have reasonable P/E ratios and have grown earnings strongly.
New: Manage All Your Stock Portfolios in One Place
We've created the ultimate portfolio companion for stock investors, and it's free.
• Connect an unlimited number of Portfolios and see your total in one currency
• Be alerted to new Warning Signs or Risks via email or mobile
• Track the Fair Value of your stocks
Have feedback on this article? Concerned about the content? Get in touch with us directly. Alternatively, email editorial-team (at) simplywallst.com.
This article by Simply Wall St is general in nature. We provide commentary based on historical data and analyst forecasts only using an unbiased methodology and our articles are not intended to be financial advice. It does not constitute a recommendation to buy or sell any stock, and does not take account of your objectives, or your financial situation. We aim to bring you long-term focused analysis driven by fundamental data. Note that our analysis may not factor in the latest price-sensitive company announcements or qualitative material. Simply Wall St has no position in any stocks mentioned.
About KLSE:G3
G3 Global Berhad
An investment holding company, provides information and communication technology services in Malaysia.
Flawless balance sheet with slight risk.
Similar Companies
Market Insights

Advertisement
Community Narratives
MicroVision will explode future revenue by 380.37% with a vision towards success
Fair Value US$60|98.4% undervalued
TH
Community Contributor
The Indispensable Artery for a New North American Economy
Fair Value CA$132.87|0.7% overvalued
TI
Community Contributor
Recently Updated Narratives
CO

composite32 on Astor Enerji ·
Astor Enerji will surge with a fair value of $140.43 in the next 3 years
Fair Value:₺140.4335.5% undervalued
1 followerusers have followed this narrative
0 commentsusers have commented on this narrative
0 likesusers have liked this narrative
RE

RecMag on Proximus ·
Proximus: The State-Backed Backup Plan with 7% Gross Yield and 15% Currency Upside.
Fair Value:€17.1356.7% undervalued
30 followersusers have followed this narrative
0 commentsusers have commented on this narrative
0 likesusers have liked this narrative
AG


Agricola on IMPACT Silver ·
A case for for IMPACT Silver Corp (TSXV:IPT) to reach USD $4.52 (CAD $6.16) in 2026 (23 bagger in 1 year) and USD $5.76 (CAD $7.89) by 2030
Fair Value:CA$7.8996.2% undervalued
1 followerusers have followed this narrative
0 commentsusers have commented on this narrative
0 likesusers have liked this narrative
Popular Narratives
TH

TheWallstreetKing on MicroVision ·
MicroVision will explode future revenue by 380.37% with a vision towards success
Fair Value:US$6098.4% undervalued
101 followersusers have followed this narrative
10 commentsusers have commented on this narrative
20 likesusers have liked this narrative
OS


oscargarcia on Alphabet ·
The company that turned a verb into a global necessity and basically runs the modern internet, digital ads, smartphones, maps, and AI.
Fair Value:US$3405.8% undervalued
139 followersusers have followed this narrative
6 commentsusers have commented on this narrative
18 likesusers have liked this narrative
AN


AnalystConsensusTarget on NVIDIA ·
NVDA: Expanding AI Demand Will Drive Major Data Center Investments Through 2026
Fair Value:US$250.3929.3% undervalued
931 followersusers have followed this narrative
6 commentsusers have commented on this narrative
23 likesusers have liked this narrative