- Malaysia
- /
- Medical Equipment
- /
- KLSE:CAREPLS
Careplus Group Berhad (KLSE:CAREPLS) Shares Fly 63% But Investors Aren't Buying For Growth
The Careplus Group Berhad (KLSE:CAREPLS) share price has done very well over the last month, posting an excellent gain of 63%. The last 30 days bring the annual gain to a very sharp 29%.
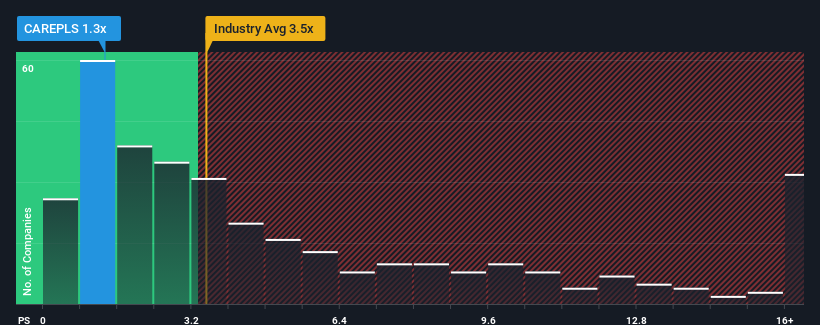
Although its price has surged higher, considering around half the companies operating in Malaysia's Medical Equipment industry have price-to-sales ratios (or "P/S") above 2.7x, you may still consider Careplus Group Berhad as an solid investment opportunity with its 1.3x P/S ratio. Although, it's not wise to just take the P/S at face value as there may be an explanation why it's limited.
See our latest analysis for Careplus Group Berhad

What Does Careplus Group Berhad's P/S Mean For Shareholders?
For instance, Careplus Group Berhad's receding revenue in recent times would have to be some food for thought. One possibility is that the P/S is low because investors think the company won't do enough to avoid underperforming the broader industry in the near future. However, if this doesn't eventuate then existing shareholders may be feeling optimistic about the future direction of the share price.
Although there are no analyst estimates available for Careplus Group Berhad, take a look at this free data-rich visualisation to see how the company stacks up on earnings, revenue and cash flow.How Is Careplus Group Berhad's Revenue Growth Trending?
The only time you'd be truly comfortable seeing a P/S as low as Careplus Group Berhad's is when the company's growth is on track to lag the industry.
Taking a look back first, the company's revenue growth last year wasn't something to get excited about as it posted a disappointing decline of 46%. The last three years don't look nice either as the company has shrunk revenue by 51% in aggregate. Accordingly, shareholders would have felt downbeat about the medium-term rates of revenue growth.
Weighing that medium-term revenue trajectory against the broader industry's one-year forecast for expansion of 23% shows it's an unpleasant look.
In light of this, it's understandable that Careplus Group Berhad's P/S would sit below the majority of other companies. Nonetheless, there's no guarantee the P/S has reached a floor yet with revenue going in reverse. There's potential for the P/S to fall to even lower levels if the company doesn't improve its top-line growth.
The Bottom Line On Careplus Group Berhad's P/S
Despite Careplus Group Berhad's share price climbing recently, its P/S still lags most other companies. Generally, our preference is to limit the use of the price-to-sales ratio to establishing what the market thinks about the overall health of a company.
As we suspected, our examination of Careplus Group Berhad revealed its shrinking revenue over the medium-term is contributing to its low P/S, given the industry is set to grow. At this stage investors feel the potential for an improvement in revenue isn't great enough to justify a higher P/S ratio. Unless the recent medium-term conditions improve, they will continue to form a barrier for the share price around these levels.
It is also worth noting that we have found 4 warning signs for Careplus Group Berhad (2 are significant!) that you need to take into consideration.
Of course, profitable companies with a history of great earnings growth are generally safer bets. So you may wish to see this free collection of other companies that have reasonable P/E ratios and have grown earnings strongly.
New: AI Stock Screener & Alerts
Our new AI Stock Screener scans the market every day to uncover opportunities.
• Dividend Powerhouses (3%+ Yield)
• Undervalued Small Caps with Insider Buying
• High growth Tech and AI Companies
Or build your own from over 50 metrics.
Have feedback on this article? Concerned about the content? Get in touch with us directly. Alternatively, email editorial-team (at) simplywallst.com.
This article by Simply Wall St is general in nature. We provide commentary based on historical data and analyst forecasts only using an unbiased methodology and our articles are not intended to be financial advice. It does not constitute a recommendation to buy or sell any stock, and does not take account of your objectives, or your financial situation. We aim to bring you long-term focused analysis driven by fundamental data. Note that our analysis may not factor in the latest price-sensitive company announcements or qualitative material. Simply Wall St has no position in any stocks mentioned.
About KLSE:CAREPLS
Careplus Group Berhad
An investment holding company, manufactures and processes gloves in South America, North America, Malaysia, rest of Asia Pacific, and internationally.
Adequate balance sheet with low risk.
Market Insights
Weekly Picks

Solutions by stc: 34% Upside in Saudi's Digital Transformation Leader


The AI Infrastructure Giant Grows Into Its Valuation
Recently Updated Narratives


The "Sleeping Giant" Wakes Up – Efficiency & Monetization


The "Rate Cut" Supercycle Winner – Profitable & Accelerating


The Industrialist of the Skies – Scaling with "Automotive DNA
Popular Narratives


MicroVision will explode future revenue by 380.37% with a vision towards success


NVDA: Expanding AI Demand Will Drive Major Data Center Investments Through 2026


