
Advertisement
- Malaysia
- /
- Energy Services
- /
- KLSE:LFG
Icon Offshore Berhad (KLSE:ICON) Stocks Pounded By 26% But Not Lagging Industry On Growth Or Pricing

Icon Offshore Berhad (KLSE:ICON) shares have had a horrible month, losing 26% after a relatively good period beforehand. Looking back over the past twelve months the stock has been a solid performer regardless, with a gain of 20%.
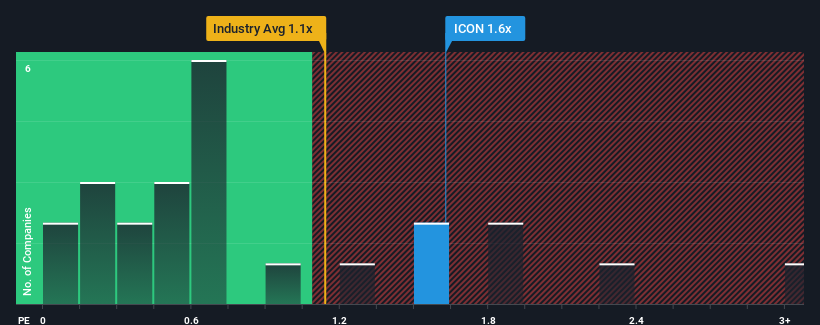
In spite of the heavy fall in price, you could still be forgiven for thinking Icon Offshore Berhad is a stock not worth researching with a price-to-sales ratios (or "P/S") of 1.6x, considering almost half the companies in Malaysia's Energy Services industry have P/S ratios below 0.7x. However, the P/S might be high for a reason and it requires further investigation to determine if it's justified.
View our latest analysis for Icon Offshore Berhad
How Has Icon Offshore Berhad Performed Recently?
While the industry has experienced revenue growth lately, Icon Offshore Berhad's revenue has gone into reverse gear, which is not great. It might be that many expect the dour revenue performance to recover substantially, which has kept the P/S from collapsing. You'd really hope so, otherwise you're paying a pretty hefty price for no particular reason.
If you'd like to see what analysts are forecasting going forward, you should check out our free report on Icon Offshore Berhad.How Is Icon Offshore Berhad's Revenue Growth Trending?
The only time you'd be truly comfortable seeing a P/S as high as Icon Offshore Berhad's is when the company's growth is on track to outshine the industry.
In reviewing the last year of financials, we were disheartened to see the company's revenues fell to the tune of 30%. The last three years don't look nice either as the company has shrunk revenue by 5.8% in aggregate. So unfortunately, we have to acknowledge that the company has not done a great job of growing revenue over that time.
Looking ahead now, revenue is anticipated to climb by 11% per year during the coming three years according to the two analysts following the company. That's shaping up to be materially higher than the 3.1% per year growth forecast for the broader industry.
With this information, we can see why Icon Offshore Berhad is trading at such a high P/S compared to the industry. Apparently shareholders aren't keen to offload something that is potentially eyeing a more prosperous future.
The Bottom Line On Icon Offshore Berhad's P/S
There's still some elevation in Icon Offshore Berhad's P/S, even if the same can't be said for its share price recently. While the price-to-sales ratio shouldn't be the defining factor in whether you buy a stock or not, it's quite a capable barometer of revenue expectations.
As we suspected, our examination of Icon Offshore Berhad's analyst forecasts revealed that its superior revenue outlook is contributing to its high P/S. It appears that shareholders are confident in the company's future revenues, which is propping up the P/S. It's hard to see the share price falling strongly in the near future under these circumstances.
Before you settle on your opinion, we've discovered 5 warning signs for Icon Offshore Berhad that you should be aware of.
If companies with solid past earnings growth is up your alley, you may wish to see this free collection of other companies with strong earnings growth and low P/E ratios.
New: AI Stock Screener & Alerts
Our new AI Stock Screener scans the market every day to uncover opportunities.
• Dividend Powerhouses (3%+ Yield)
• Undervalued Small Caps with Insider Buying
• High growth Tech and AI Companies
Or build your own from over 50 metrics.
Have feedback on this article? Concerned about the content? Get in touch with us directly. Alternatively, email editorial-team (at) simplywallst.com.
This article by Simply Wall St is general in nature. We provide commentary based on historical data and analyst forecasts only using an unbiased methodology and our articles are not intended to be financial advice. It does not constitute a recommendation to buy or sell any stock, and does not take account of your objectives, or your financial situation. We aim to bring you long-term focused analysis driven by fundamental data. Note that our analysis may not factor in the latest price-sensitive company announcements or qualitative material. Simply Wall St has no position in any stocks mentioned.
About KLSE:LFG
Lianson Fleet Group Berhad
An investment holding company, provides offshore marine services to the oil and gas related industries in Malaysia and Brunei.
Flawless balance sheet with solid track record.
Market Insights

Advertisement
Community Narratives
The Most Undervalued of the Magnificent 7
Fair Value US$237.43|36.3% undervalued
IN
Community Contributor
PVA TePla's New Strategy Aims for 22% Revenue Growth in Semiconductor Recovery
Fair Value €19.19|20.8% undervalued
MI
Community Contributor