YLI Holdings Berhad (KLSE:YLI) Surges 27% Yet Its Low P/S Is No Reason For Excitement


YLI Holdings Berhad (KLSE:YLI) shareholders have had their patience rewarded with a 27% share price jump in the last month. Looking back a bit further, it's encouraging to see the stock is up 63% in the last year.
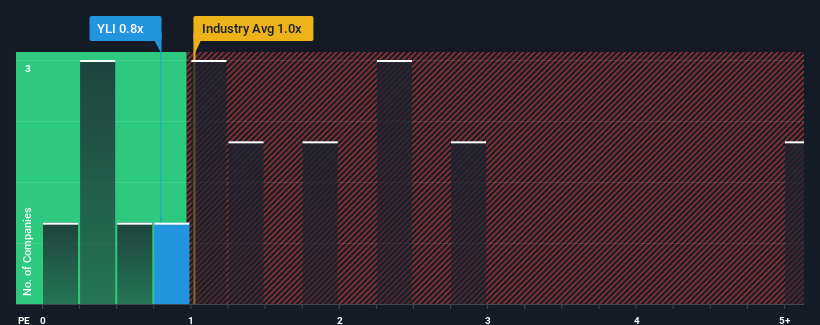
In spite of the firm bounce in price, when close to half the companies operating in Malaysia's Building industry have price-to-sales ratios (or "P/S") above 1.4x, you may still consider YLI Holdings Berhad as an enticing stock to check out with its 0.8x P/S ratio. Nonetheless, we'd need to dig a little deeper to determine if there is a rational basis for the reduced P/S.
View our latest analysis for YLI Holdings Berhad
How YLI Holdings Berhad Has Been Performing
For instance, YLI Holdings Berhad's receding revenue in recent times would have to be some food for thought. Perhaps the market believes the recent revenue performance isn't good enough to keep up the industry, causing the P/S ratio to suffer. If you like the company, you'd be hoping this isn't the case so that you could potentially pick up some stock while it's out of favour.
Want the full picture on earnings, revenue and cash flow for the company? Then our free report on YLI Holdings Berhad will help you shine a light on its historical performance.Do Revenue Forecasts Match The Low P/S Ratio?
The only time you'd be truly comfortable seeing a P/S as low as YLI Holdings Berhad's is when the company's growth is on track to lag the industry.
Taking a look back first, the company's revenue growth last year wasn't something to get excited about as it posted a disappointing decline of 15%. The last three years don't look nice either as the company has shrunk revenue by 29% in aggregate. Accordingly, shareholders would have felt downbeat about the medium-term rates of revenue growth.
In contrast to the company, the rest of the industry is expected to grow by 9.1% over the next year, which really puts the company's recent medium-term revenue decline into perspective.
In light of this, it's understandable that YLI Holdings Berhad's P/S would sit below the majority of other companies. Nonetheless, there's no guarantee the P/S has reached a floor yet with revenue going in reverse. Even just maintaining these prices could be difficult to achieve as recent revenue trends are already weighing down the shares.
What We Can Learn From YLI Holdings Berhad's P/S?
The latest share price surge wasn't enough to lift YLI Holdings Berhad's P/S close to the industry median. Using the price-to-sales ratio alone to determine if you should sell your stock isn't sensible, however it can be a practical guide to the company's future prospects.
As we suspected, our examination of YLI Holdings Berhad revealed its shrinking revenue over the medium-term is contributing to its low P/S, given the industry is set to grow. At this stage investors feel the potential for an improvement in revenue isn't great enough to justify a higher P/S ratio. Given the current circumstances, it seems unlikely that the share price will experience any significant movement in either direction in the near future if recent medium-term revenue trends persist.
It's always necessary to consider the ever-present spectre of investment risk. We've identified 2 warning signs with YLI Holdings Berhad (at least 1 which makes us a bit uncomfortable), and understanding these should be part of your investment process.
If you're unsure about the strength of YLI Holdings Berhad's business, why not explore our interactive list of stocks with solid business fundamentals for some other companies you may have missed.
New: Manage All Your Stock Portfolios in One Place
We've created the ultimate portfolio companion for stock investors, and it's free.
• Connect an unlimited number of Portfolios and see your total in one currency
• Be alerted to new Warning Signs or Risks via email or mobile
• Track the Fair Value of your stocks
Have feedback on this article? Concerned about the content? Get in touch with us directly. Alternatively, email editorial-team (at) simplywallst.com.
This article by Simply Wall St is general in nature. We provide commentary based on historical data and analyst forecasts only using an unbiased methodology and our articles are not intended to be financial advice. It does not constitute a recommendation to buy or sell any stock, and does not take account of your objectives, or your financial situation. We aim to bring you long-term focused analysis driven by fundamental data. Note that our analysis may not factor in the latest price-sensitive company announcements or qualitative material. Simply Wall St has no position in any stocks mentioned.
About KLSE:YLI
YLI Holdings Berhad
An investment holding company, manufactures and trades in ductile iron pipes, steel and plastic pipes and fittings, and waterworks related products for the sewerage and waterworks industries in Malaysia, Singapore, and Vietnam.
Adequate balance sheet and slightly overvalued.
Market Insights

Community Narratives


