
Advertisement
- Malaysia
- /
- Trade Distributors
- /
- KLSE:SAMCHEM
Investors Could Be Concerned With Samchem Holdings Berhad's (KLSE:SAMCHEM) Returns On Capital

Did you know there are some financial metrics that can provide clues of a potential multi-bagger? Firstly, we'd want to identify a growing return on capital employed (ROCE) and then alongside that, an ever-increasing base of capital employed. Put simply, these types of businesses are compounding machines, meaning they are continually reinvesting their earnings at ever-higher rates of return. However, after briefly looking over the numbers, we don't think Samchem Holdings Berhad (KLSE:SAMCHEM) has the makings of a multi-bagger going forward, but let's have a look at why that may be.
Return On Capital Employed (ROCE): What Is It?
For those that aren't sure what ROCE is, it measures the amount of pre-tax profits a company can generate from the capital employed in its business. To calculate this metric for Samchem Holdings Berhad, this is the formula:
Return on Capital Employed = Earnings Before Interest and Tax (EBIT) ÷ (Total Assets - Current Liabilities)
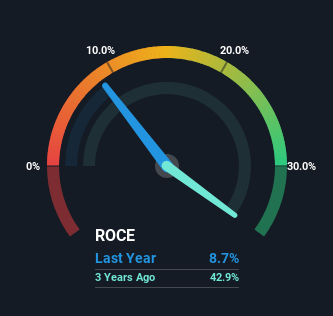
0.087 = RM30m ÷ (RM583m - RM234m) (Based on the trailing twelve months to December 2024).
Thus, Samchem Holdings Berhad has an ROCE of 8.7%. On its own, that's a low figure but it's around the 7.9% average generated by the Trade Distributors industry.
See our latest analysis for Samchem Holdings Berhad
While the past is not representative of the future, it can be helpful to know how a company has performed historically, which is why we have this chart above. If you're interested in investigating Samchem Holdings Berhad's past further, check out this free graph covering Samchem Holdings Berhad's past earnings, revenue and cash flow.
The Trend Of ROCE
When we looked at the ROCE trend at Samchem Holdings Berhad, we didn't gain much confidence. Over the last five years, returns on capital have decreased to 8.7% from 25% five years ago. Meanwhile, the business is utilizing more capital but this hasn't moved the needle much in terms of sales in the past 12 months, so this could reflect longer term investments. It's worth keeping an eye on the company's earnings from here on to see if these investments do end up contributing to the bottom line.
On a side note, Samchem Holdings Berhad has done well to pay down its current liabilities to 40% of total assets. That could partly explain why the ROCE has dropped. What's more, this can reduce some aspects of risk to the business because now the company's suppliers or short-term creditors are funding less of its operations. Since the business is basically funding more of its operations with it's own money, you could argue this has made the business less efficient at generating ROCE. Keep in mind 40% is still pretty high, so those risks are still somewhat prevalent.
The Bottom Line
Bringing it all together, while we're somewhat encouraged by Samchem Holdings Berhad's reinvestment in its own business, we're aware that returns are shrinking. Since the stock has gained an impressive 59% over the last five years, investors must think there's better things to come. Ultimately, if the underlying trends persist, we wouldn't hold our breath on it being a multi-bagger going forward.
On a final note, we found 4 warning signs for Samchem Holdings Berhad (1 is significant) you should be aware of.
If you want to search for solid companies with great earnings, check out this free list of companies with good balance sheets and impressive returns on equity.
New: Manage All Your Stock Portfolios in One Place
We've created the ultimate portfolio companion for stock investors, and it's free.
• Connect an unlimited number of Portfolios and see your total in one currency
• Be alerted to new Warning Signs or Risks via email or mobile
• Track the Fair Value of your stocks
Have feedback on this article? Concerned about the content? Get in touch with us directly. Alternatively, email editorial-team (at) simplywallst.com.
This article by Simply Wall St is general in nature. We provide commentary based on historical data and analyst forecasts only using an unbiased methodology and our articles are not intended to be financial advice. It does not constitute a recommendation to buy or sell any stock, and does not take account of your objectives, or your financial situation. We aim to bring you long-term focused analysis driven by fundamental data. Note that our analysis may not factor in the latest price-sensitive company announcements or qualitative material. Simply Wall St has no position in any stocks mentioned.
About KLSE:SAMCHEM
Samchem Holdings Berhad
An investment holding company, distributes industrial chemicals in Malaysia, Indonesia, Vietnam, and Singapore.
Excellent balance sheet slight.
Market Insights

Advertisement
Community Narratives
Pinterest will surge as advertising innovations ignite revenue growth
Fair Value US$42.63|26.1% undervalued
BR
Community Contributor
Brambles' Revenue Set to Climb 14% with Profit Margins Following
Fair Value AU$21.90|4.8% overvalued
RO
Community Contributor
Challenging Future for STG as Organic Sales Decline by 8.8%
Fair Value DKK 116.13|26.8% undervalued
KA
Community Contributor