
Advertisement
- Malaysia
- /
- Construction
- /
- KLSE:EDGENTA
UEM Edgenta Berhad's (KLSE:EDGENTA) earnings have declined over five years, contributing to shareholders 59% loss

UEM Edgenta Berhad (KLSE:EDGENTA) shareholders should be happy to see the share price up 27% in the last quarter. But that is little comfort to those holding over the last half decade, sitting on a big loss. In fact, the share price has declined rather badly, down some 64% in that time. So we're hesitant to put much weight behind the short term increase. Of course, this could be the start of a turnaround.
While the last five years has been tough for UEM Edgenta Berhad shareholders, this past week has shown signs of promise. So let's look at the longer term fundamentals and see if they've been the driver of the negative returns.
We've discovered 1 warning sign about UEM Edgenta Berhad. View them for free.In his essay The Superinvestors of Graham-and-Doddsville Warren Buffett described how share prices do not always rationally reflect the value of a business. One imperfect but simple way to consider how the market perception of a company has shifted is to compare the change in the earnings per share (EPS) with the share price movement.
During the five years over which the share price declined, UEM Edgenta Berhad's earnings per share (EPS) dropped by 22% each year. This change in EPS is reasonably close to the 19% average annual decrease in the share price. That suggests that the market sentiment around the company hasn't changed much over that time. Rather, the share price has approximately tracked EPS growth.
The graphic below depicts how EPS has changed over time (unveil the exact values by clicking on the image).
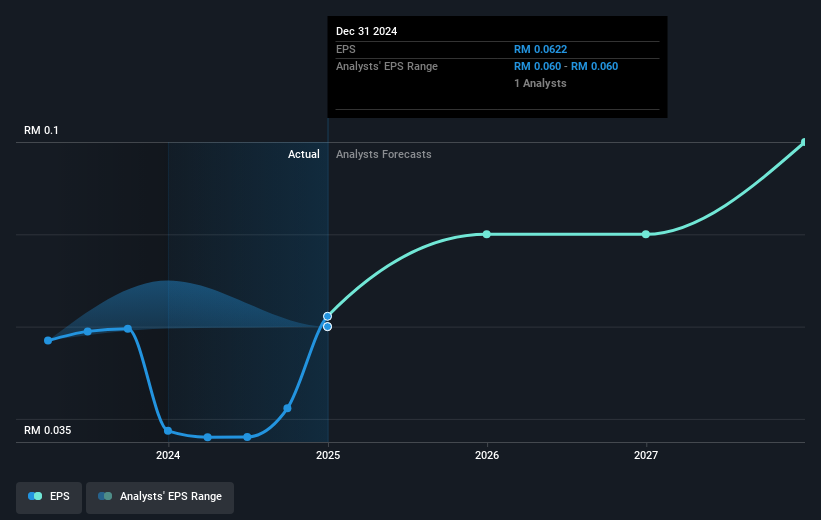
We know that UEM Edgenta Berhad has improved its bottom line lately, but is it going to grow revenue? This free report showing analyst revenue forecasts should help you figure out if the EPS growth can be sustained.
What About Dividends?
It is important to consider the total shareholder return, as well as the share price return, for any given stock. Whereas the share price return only reflects the change in the share price, the TSR includes the value of dividends (assuming they were reinvested) and the benefit of any discounted capital raising or spin-off. So for companies that pay a generous dividend, the TSR is often a lot higher than the share price return. In the case of UEM Edgenta Berhad, it has a TSR of -59% for the last 5 years. That exceeds its share price return that we previously mentioned. The dividends paid by the company have thusly boosted the total shareholder return.
A Different Perspective
It's good to see that UEM Edgenta Berhad has rewarded shareholders with a total shareholder return of 3.6% in the last twelve months. That's including the dividend. Notably the five-year annualised TSR loss of 10% per year compares very unfavourably with the recent share price performance. We generally put more weight on the long term performance over the short term, but the recent improvement could hint at a (positive) inflection point within the business. It's always interesting to track share price performance over the longer term. But to understand UEM Edgenta Berhad better, we need to consider many other factors. Case in point: We've spotted 1 warning sign for UEM Edgenta Berhad you should be aware of.
If you would prefer to check out another company -- one with potentially superior financials -- then do not miss this free list of companies that have proven they can grow earnings.
Please note, the market returns quoted in this article reflect the market weighted average returns of stocks that currently trade on Malaysian exchanges.
New: AI Stock Screener & Alerts
Our new AI Stock Screener scans the market every day to uncover opportunities.
• Dividend Powerhouses (3%+ Yield)
• Undervalued Small Caps with Insider Buying
• High growth Tech and AI Companies
Or build your own from over 50 metrics.
Have feedback on this article? Concerned about the content? Get in touch with us directly. Alternatively, email editorial-team (at) simplywallst.com.
This article by Simply Wall St is general in nature. We provide commentary based on historical data and analyst forecasts only using an unbiased methodology and our articles are not intended to be financial advice. It does not constitute a recommendation to buy or sell any stock, and does not take account of your objectives, or your financial situation. We aim to bring you long-term focused analysis driven by fundamental data. Note that our analysis may not factor in the latest price-sensitive company announcements or qualitative material. Simply Wall St has no position in any stocks mentioned.
About KLSE:EDGENTA
UEM Edgenta Berhad
An investment holding company, provides asset management and infrastructure solutions in Malaysia, the Middle East, Indonesia, Singapore, Taiwan, and India.
Excellent balance sheet with proven track record.
Similar Companies
Market Insights

Advertisement
Community Narratives

Apple: A Dying Star with an Overpriced Valuation
Fair Value US$177.34|19.7% overvalued
IN
Community Contributor
Avino a case for USD$20 per share within 5 years (assuming $3,500 gold, $100 silver and $4 copper).
Fair Value CA$26.79|87.9% undervalued
AG
Community Contributor
Riding the Defense Boom RENK Sees Revenue Climb at 15% CAGR by FY 2029
Fair Value €69.87|24.5% undervalued
CH
Community Contributor