CIMB Group Holdings Berhad (KLSE:CIMB) jumps 3.4% this week, though earnings growth is still tracking behind three-year shareholder returns


One simple way to benefit from the stock market is to buy an index fund. But many of us dare to dream of bigger returns, and build a portfolio ourselves. For example, the CIMB Group Holdings Berhad (KLSE:CIMB) share price is up 75% in the last three years, clearly besting the market return of around 7.5% (not including dividends). On the other hand, the returns haven't been quite so good recently, with shareholders up just 62%, including dividends.
Since it's been a strong week for CIMB Group Holdings Berhad shareholders, let's have a look at trend of the longer term fundamentals.
View our latest analysis for CIMB Group Holdings Berhad
There is no denying that markets are sometimes efficient, but prices do not always reflect underlying business performance. One imperfect but simple way to consider how the market perception of a company has shifted is to compare the change in the earnings per share (EPS) with the share price movement.
CIMB Group Holdings Berhad was able to grow its EPS at 21% per year over three years, sending the share price higher. Notably, the 21% average annual share price gain matches up nicely with the EPS growth rate. That suggests that the market sentiment around the company hasn't changed much over that time. Rather, the share price has approximately tracked EPS growth.
The image below shows how EPS has tracked over time (if you click on the image you can see greater detail).
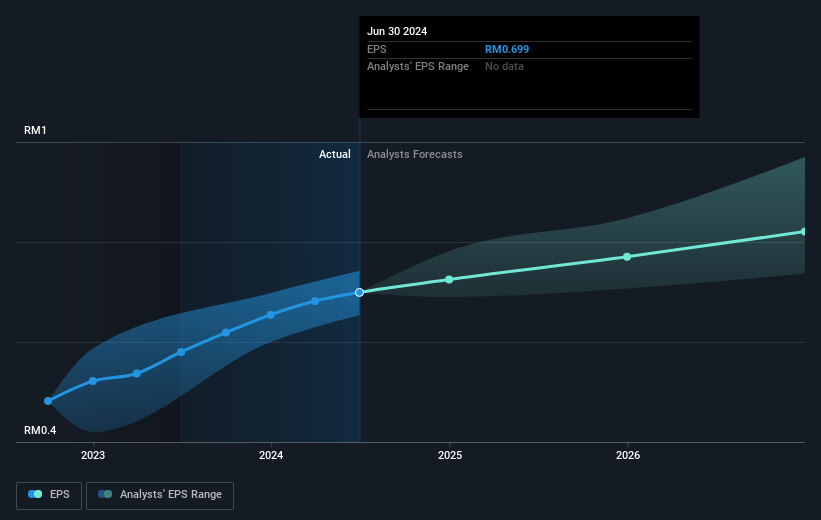
We know that CIMB Group Holdings Berhad has improved its bottom line lately, but is it going to grow revenue? This free report showing analyst revenue forecasts should help you figure out if the EPS growth can be sustained.
What About Dividends?
It is important to consider the total shareholder return, as well as the share price return, for any given stock. Whereas the share price return only reflects the change in the share price, the TSR includes the value of dividends (assuming they were reinvested) and the benefit of any discounted capital raising or spin-off. So for companies that pay a generous dividend, the TSR is often a lot higher than the share price return. We note that for CIMB Group Holdings Berhad the TSR over the last 3 years was 114%, which is better than the share price return mentioned above. The dividends paid by the company have thusly boosted the total shareholder return.
A Different Perspective
It's nice to see that CIMB Group Holdings Berhad shareholders have received a total shareholder return of 62% over the last year. And that does include the dividend. That's better than the annualised return of 17% over half a decade, implying that the company is doing better recently. In the best case scenario, this may hint at some real business momentum, implying that now could be a great time to delve deeper. While it is well worth considering the different impacts that market conditions can have on the share price, there are other factors that are even more important. Consider for instance, the ever-present spectre of investment risk. We've identified 1 warning sign with CIMB Group Holdings Berhad , and understanding them should be part of your investment process.
If you like to buy stocks alongside management, then you might just love this free list of companies. (Hint: many of them are unnoticed AND have attractive valuation).
Please note, the market returns quoted in this article reflect the market weighted average returns of stocks that currently trade on Malaysian exchanges.
New: AI Stock Screener & Alerts
Our new AI Stock Screener scans the market every day to uncover opportunities.
• Dividend Powerhouses (3%+ Yield)
• Undervalued Small Caps with Insider Buying
• High growth Tech and AI Companies
Or build your own from over 50 metrics.
Have feedback on this article? Concerned about the content? Get in touch with us directly. Alternatively, email editorial-team (at) simplywallst.com.
This article by Simply Wall St is general in nature. We provide commentary based on historical data and analyst forecasts only using an unbiased methodology and our articles are not intended to be financial advice. It does not constitute a recommendation to buy or sell any stock, and does not take account of your objectives, or your financial situation. We aim to bring you long-term focused analysis driven by fundamental data. Note that our analysis may not factor in the latest price-sensitive company announcements or qualitative material. Simply Wall St has no position in any stocks mentioned.
About KLSE:CIMB
CIMB Group Holdings Berhad
Provides various banking products and services in Malaysia and internationally.
Excellent balance sheet established dividend payer.

