
Advertisement
- Malaysia
- /
- Auto Components
- /
- KLSE:APM
How Much Did APM Automotive Holdings Berhad's(KLSE:APM) Shareholders Earn From Share Price Movements Over The Last Five Years?
While it may not be enough for some shareholders, we think it is good to see the APM Automotive Holdings Berhad (KLSE:APM) share price up 26% in a single quarter. But that doesn't change the fact that the returns over the last five years have been less than pleasing. In fact, the share price is down 45%, which falls well short of the return you could get by buying an index fund.
See our latest analysis for APM Automotive Holdings Berhad
There is no denying that markets are sometimes efficient, but prices do not always reflect underlying business performance. One way to examine how market sentiment has changed over time is to look at the interaction between a company's share price and its earnings per share (EPS).
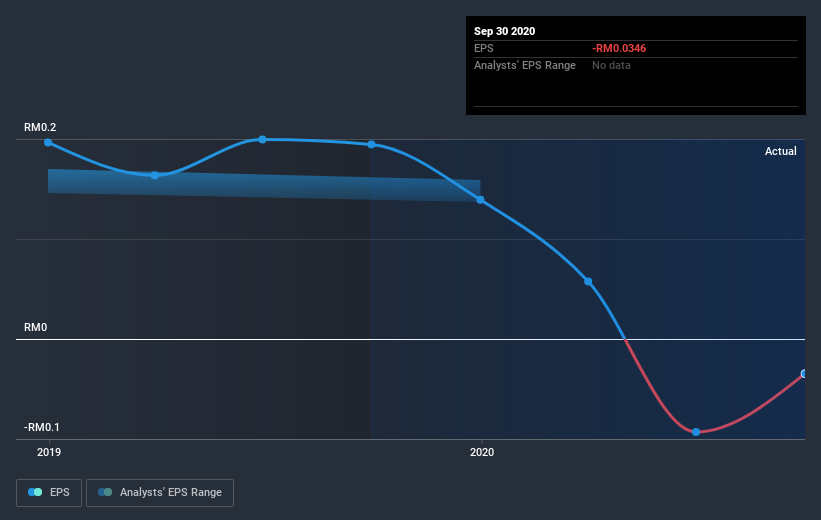
In the last half decade APM Automotive Holdings Berhad saw its share price fall as its EPS declined below zero. This was, in part, due to extraordinary items impacting earnings. At present it's hard to make valid comparisons between EPS and the share price. But we would generally expect a lower price, given the situation.
The image below shows how EPS has tracked over time (if you click on the image you can see greater detail).
Dive deeper into APM Automotive Holdings Berhad's key metrics by checking this interactive graph of APM Automotive Holdings Berhad's earnings, revenue and cash flow.
What About Dividends?
As well as measuring the share price return, investors should also consider the total shareholder return (TSR). The TSR incorporates the value of any spin-offs or discounted capital raisings, along with any dividends, based on the assumption that the dividends are reinvested. It's fair to say that the TSR gives a more complete picture for stocks that pay a dividend. We note that for APM Automotive Holdings Berhad the TSR over the last 5 years was -33%, which is better than the share price return mentioned above. And there's no prize for guessing that the dividend payments largely explain the divergence!
A Different Perspective
It's nice to see that APM Automotive Holdings Berhad shareholders have received a total shareholder return of 5.5% over the last year. And that does include the dividend. Notably the five-year annualised TSR loss of 6% per year compares very unfavourably with the recent share price performance. This makes us a little wary, but the business might have turned around its fortunes. While it is well worth considering the different impacts that market conditions can have on the share price, there are other factors that are even more important. To that end, you should learn about the 3 warning signs we've spotted with APM Automotive Holdings Berhad (including 1 which is shouldn't be ignored) .
We will like APM Automotive Holdings Berhad better if we see some big insider buys. While we wait, check out this free list of growing companies with considerable, recent, insider buying.
Please note, the market returns quoted in this article reflect the market weighted average returns of stocks that currently trade on MY exchanges.
If you’re looking to trade APM Automotive Holdings Berhad, open an account with the lowest-cost* platform trusted by professionals, Interactive Brokers. Their clients from over 200 countries and territories trade stocks, options, futures, forex, bonds and funds worldwide from a single integrated account. Promoted
New: Manage All Your Stock Portfolios in One Place
We've created the ultimate portfolio companion for stock investors, and it's free.
• Connect an unlimited number of Portfolios and see your total in one currency
• Be alerted to new Warning Signs or Risks via email or mobile
• Track the Fair Value of your stocks
This article by Simply Wall St is general in nature. It does not constitute a recommendation to buy or sell any stock, and does not take account of your objectives, or your financial situation. We aim to bring you long-term focused analysis driven by fundamental data. Note that our analysis may not factor in the latest price-sensitive company announcements or qualitative material. Simply Wall St has no position in any stocks mentioned.
*Interactive Brokers Rated Lowest Cost Broker by StockBrokers.com Annual Online Review 2020
Have feedback on this article? Concerned about the content? Get in touch with us directly. Alternatively, email editorial-team@simplywallst.com.
About KLSE:APM
APM Automotive Holdings Berhad
An investment holding company, designs, assembles, manufactures, produces, and distributes automotive and locomotive components in Malaysia, Indonesia, Vietnam, Europe, the United States, Australia, and internationally.
Excellent balance sheet established dividend payer.
Similar Companies
Market Insights

Advertisement
Community Narratives
A formidable player in AI and enterprise computing.
Fair Value US$210.00|12.2% overvalued
CO
Community Contributor
IREN's Bold Moves in Sustainable Bitcoin Mining & AI Data Centers
Fair Value US$72.52|17.1% undervalued
BL
Community Contributor
Cooling the Champions: The Aussie Tech Behind F1's Victories
Fair Value AU$12.40|38.7% undervalued
TR
Community Contributor