- Mexico
- /
- Infrastructure
- /
- BMV:ALEATIC *
Aleatica. de's (BMV:ALEATIC) Stock Price Has Reduced 39% In The Past Three Years


Many investors define successful investing as beating the market average over the long term. But if you try your hand at stock picking, your risk returning less than the market. Unfortunately, that's been the case for longer term Aleatica, S.A.B. de C.V. (BMV:ALEATIC) shareholders, since the share price is down 39% in the last three years, falling well short of the market decline of around 5.2%. And the ride hasn't got any smoother in recent times over the last year, with the price 23% lower in that time. Unhappily, the share price slid 4.0% in the last week.
Check out our latest analysis for Aleatica. de
While markets are a powerful pricing mechanism, share prices reflect investor sentiment, not just underlying business performance. By comparing earnings per share (EPS) and share price changes over time, we can get a feel for how investor attitudes to a company have morphed over time.
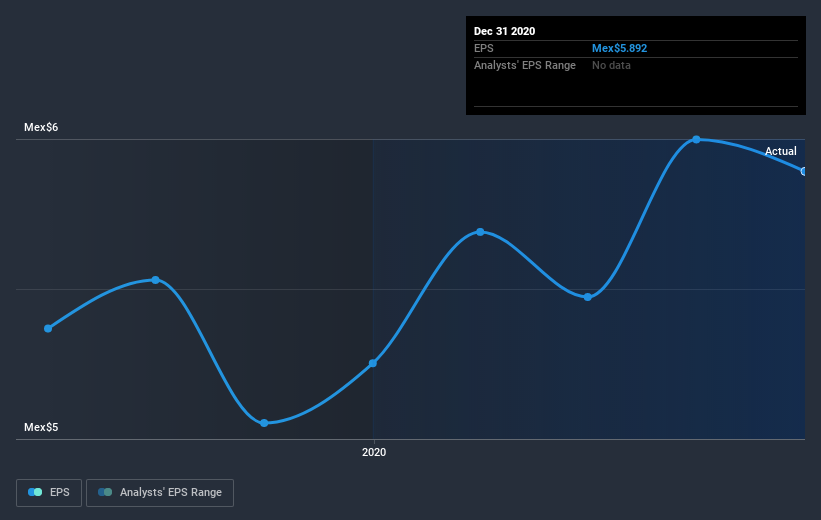
During the three years that the share price fell, Aleatica. de's earnings per share (EPS) dropped by 1.3% each year. The share price decline of 15% is actually steeper than the EPS slippage. So it's likely that the EPS decline has disappointed the market, leaving investors hesitant to buy. The less favorable sentiment is reflected in its current P/E ratio of 3.50.
The company's earnings per share (over time) is depicted in the image below (click to see the exact numbers).
Dive deeper into Aleatica. de's key metrics by checking this interactive graph of Aleatica. de's earnings, revenue and cash flow.
What About Dividends?
As well as measuring the share price return, investors should also consider the total shareholder return (TSR). The TSR incorporates the value of any spin-offs or discounted capital raisings, along with any dividends, based on the assumption that the dividends are reinvested. It's fair to say that the TSR gives a more complete picture for stocks that pay a dividend. We note that for Aleatica. de the TSR over the last 3 years was -31%, which is better than the share price return mentioned above. The dividends paid by the company have thusly boosted the total shareholder return.
A Different Perspective
While the broader market gained around 7.0% in the last year, Aleatica. de shareholders lost 21% (even including dividends). However, keep in mind that even the best stocks will sometimes underperform the market over a twelve month period. Unfortunately, last year's performance may indicate unresolved challenges, given that it was worse than the annualised loss of 0.8% over the last half decade. Generally speaking long term share price weakness can be a bad sign, though contrarian investors might want to research the stock in hope of a turnaround. While it is well worth considering the different impacts that market conditions can have on the share price, there are other factors that are even more important. Case in point: We've spotted 2 warning signs for Aleatica. de you should be aware of.
We will like Aleatica. de better if we see some big insider buys. While we wait, check out this free list of growing companies with considerable, recent, insider buying.
Please note, the market returns quoted in this article reflect the market weighted average returns of stocks that currently trade on MX exchanges.
When trading Aleatica. de or any other investment, use the platform considered by many to be the Professional's Gateway to the Worlds Market, Interactive Brokers. You get the lowest-cost* trading on stocks, options, futures, forex, bonds and funds worldwide from a single integrated account. Promoted
New: Manage All Your Stock Portfolios in One Place
We've created the ultimate portfolio companion for stock investors, and it's free.
• Connect an unlimited number of Portfolios and see your total in one currency
• Be alerted to new Warning Signs or Risks via email or mobile
• Track the Fair Value of your stocks
This article by Simply Wall St is general in nature. It does not constitute a recommendation to buy or sell any stock, and does not take account of your objectives, or your financial situation. We aim to bring you long-term focused analysis driven by fundamental data. Note that our analysis may not factor in the latest price-sensitive company announcements or qualitative material. Simply Wall St has no position in any stocks mentioned.
*Interactive Brokers Rated Lowest Cost Broker by StockBrokers.com Annual Online Review 2020
Have feedback on this article? Concerned about the content? Get in touch with us directly. Alternatively, email editorial-team (at) simplywallst.com.
About BMV:ALEATIC *
Aleatica. de
Engages in the design and operation of highways and other mobility assets in Europe and Latin America.
Mediocre balance sheet with questionable track record.

