- South Korea
- /
- Electronic Equipment and Components
- /
- KOSE:A034220
Further weakness as LG Display (KRX:034220) drops 4.8% this week, taking three-year losses to 33%

For many investors, the main point of stock picking is to generate higher returns than the overall market. But its virtually certain that sometimes you will buy stocks that fall short of the market average returns. We regret to report that long term LG Display Co., Ltd. (KRX:034220) shareholders have had that experience, with the share price dropping 41% in three years, versus a market decline of about 5.2%. Shareholders have had an even rougher run lately, with the share price down 17% in the last 90 days. But this could be related to the weak market, which is down 9.6% in the same period.
With the stock having lost 4.8% in the past week, it's worth taking a look at business performance and seeing if there's any red flags.
Check out our latest analysis for LG Display
LG Display isn't currently profitable, so most analysts would look to revenue growth to get an idea of how fast the underlying business is growing. When a company doesn't make profits, we'd generally hope to see good revenue growth. That's because it's hard to be confident a company will be sustainable if revenue growth is negligible, and it never makes a profit.
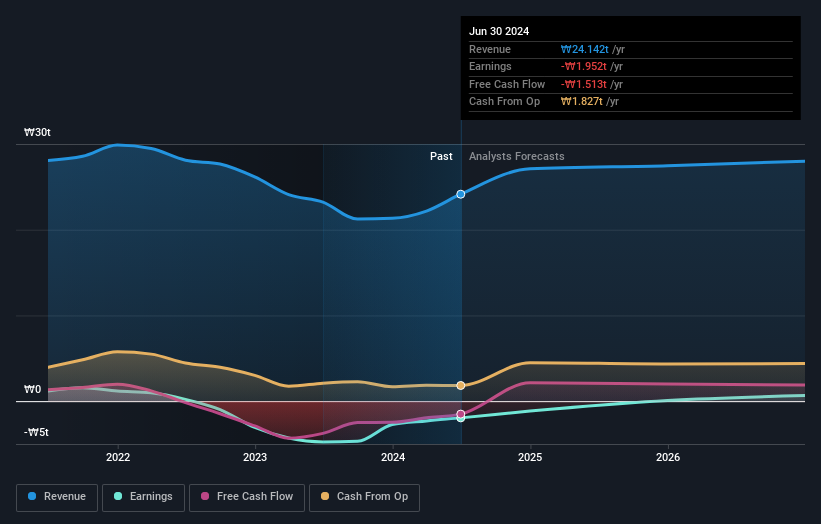
Over the last three years, LG Display's revenue dropped 11% per year. That is not a good result. The annual decline of 12% per year in that period has clearly disappointed holders. And with no profits, and weak revenue, are you surprised? Of course, sentiment could become too negative, and the company may actually be making progress to profitability.
The graphic below depicts how earnings and revenue have changed over time (unveil the exact values by clicking on the image).
LG Display is a well known stock, with plenty of analyst coverage, suggesting some visibility into future growth. Given we have quite a good number of analyst forecasts, it might be well worth checking out this free chart depicting consensus estimates.
What About The Total Shareholder Return (TSR)?
Investors should note that there's a difference between LG Display's total shareholder return (TSR) and its share price change, which we've covered above. The TSR is a return calculation that accounts for the value of cash dividends (assuming that any dividend received was reinvested) and the calculated value of any discounted capital raisings and spin-offs. Dividends have been really beneficial for LG Display shareholders, and that cash payout explains why its total shareholder loss of 33%, over the last 3 years, isn't as bad as the share price return.
A Different Perspective
Investors in LG Display had a tough year, with a total loss of 6.4%, against a market gain of about 8.3%. However, keep in mind that even the best stocks will sometimes underperform the market over a twelve month period. Regrettably, last year's performance caps off a bad run, with the shareholders facing a total loss of 3% per year over five years. We realise that Baron Rothschild has said investors should "buy when there is blood on the streets", but we caution that investors should first be sure they are buying a high quality business. It's always interesting to track share price performance over the longer term. But to understand LG Display better, we need to consider many other factors. Even so, be aware that LG Display is showing 1 warning sign in our investment analysis , you should know about...
We will like LG Display better if we see some big insider buys. While we wait, check out this free list of undervalued stocks (mostly small caps) with considerable, recent, insider buying.
Please note, the market returns quoted in this article reflect the market weighted average returns of stocks that currently trade on South Korean exchanges.
The New Payments ETF Is Live on NASDAQ:
Money is moving to real-time rails, and a newly listed ETF now gives investors direct exposure. Fast settlement. Institutional custody. Simple access.
Explore how this launch could reshape portfolios
Sponsored ContentNew: AI Stock Screener & Alerts
Our new AI Stock Screener scans the market every day to uncover opportunities.
• Dividend Powerhouses (3%+ Yield)
• Undervalued Small Caps with Insider Buying
• High growth Tech and AI Companies
Or build your own from over 50 metrics.
Have feedback on this article? Concerned about the content? Get in touch with us directly. Alternatively, email editorial-team (at) simplywallst.com.
This article by Simply Wall St is general in nature. We provide commentary based on historical data and analyst forecasts only using an unbiased methodology and our articles are not intended to be financial advice. It does not constitute a recommendation to buy or sell any stock, and does not take account of your objectives, or your financial situation. We aim to bring you long-term focused analysis driven by fundamental data. Note that our analysis may not factor in the latest price-sensitive company announcements or qualitative material. Simply Wall St has no position in any stocks mentioned.
About KOSE:A034220
LG Display
Engages in the manufacture and sale of thin-film transistor liquid crystal display (TFT-LCD) and organic light-emitting diode (OLED) technology-based display panels in Korea, China, rest of Asia, the Americas, Poland, and rest of Europe.
Undervalued with moderate growth potential.
Similar Companies
Market Insights

Weekly Picks

Early mover in a fast growing industry. Likely to experience share price volatility as they scale


A case for CA$31.80 (undiluted), aka 8,616% upside from CA$0.37 (an 86 bagger!).


Moderation and Stabilisation: HOLD: Fair Price based on a 4-year Cycle is $12.08
Recently Updated Narratives


An amazing opportunity to potentially get a 100 bagger

Amazon: Why the World’s Biggest Platform Still Runs on Invisible Economics

Sunrun Stock: When the Energy Transition Collides With the Cost of Capital
Popular Narratives


MicroVision will explode future revenue by 380.37% with a vision towards success


Crazy Undervalued 42 Baggers Silver Play (Active & Running Mine)

