
Advertisement
- South Korea
- /
- Electronic Equipment and Components
- /
- KOSE:A009470
The three-year decline in earnings might be taking its toll on Samwha ElectricLtd (KRX:009470) shareholders as stock falls 13% over the past week
Samwha Electric Co.,Ltd. (KRX:009470) shareholders might be concerned after seeing the share price drop 13% in the last week. But that doesn't change the fact that the returns over the last three years have been very strong. In three years the stock price has launched 135% higher: a great result. It's not uncommon to see a share price retrace a bit, after a big gain. The fundamental business performance will ultimately dictate whether the top is in, or if this is a stellar buying opportunity.
Since the long term performance has been good but there's been a recent pullback of 13%, let's check if the fundamentals match the share price.
While markets are a powerful pricing mechanism, share prices reflect investor sentiment, not just underlying business performance. One way to examine how market sentiment has changed over time is to look at the interaction between a company's share price and its earnings per share (EPS).
Over the last three years, Samwha ElectricLtd failed to grow earnings per share, which fell 4.7% (annualized).
Based on these numbers, we think that the decline in earnings per share may not be a good representation of how the business has changed over the years. Since the change in EPS doesn't seem to correlate with the change in share price, it's worth taking a look at other metrics.
The modest 1.4% dividend yield is unlikely to be propping up the share price. You can only imagine how long term shareholders feel about the declining revenue trend (slipping at 2.3% per year). The only thing that's clear is there is low correlation between Samwha ElectricLtd's share price and its historic fundamental data. Further research may be required!
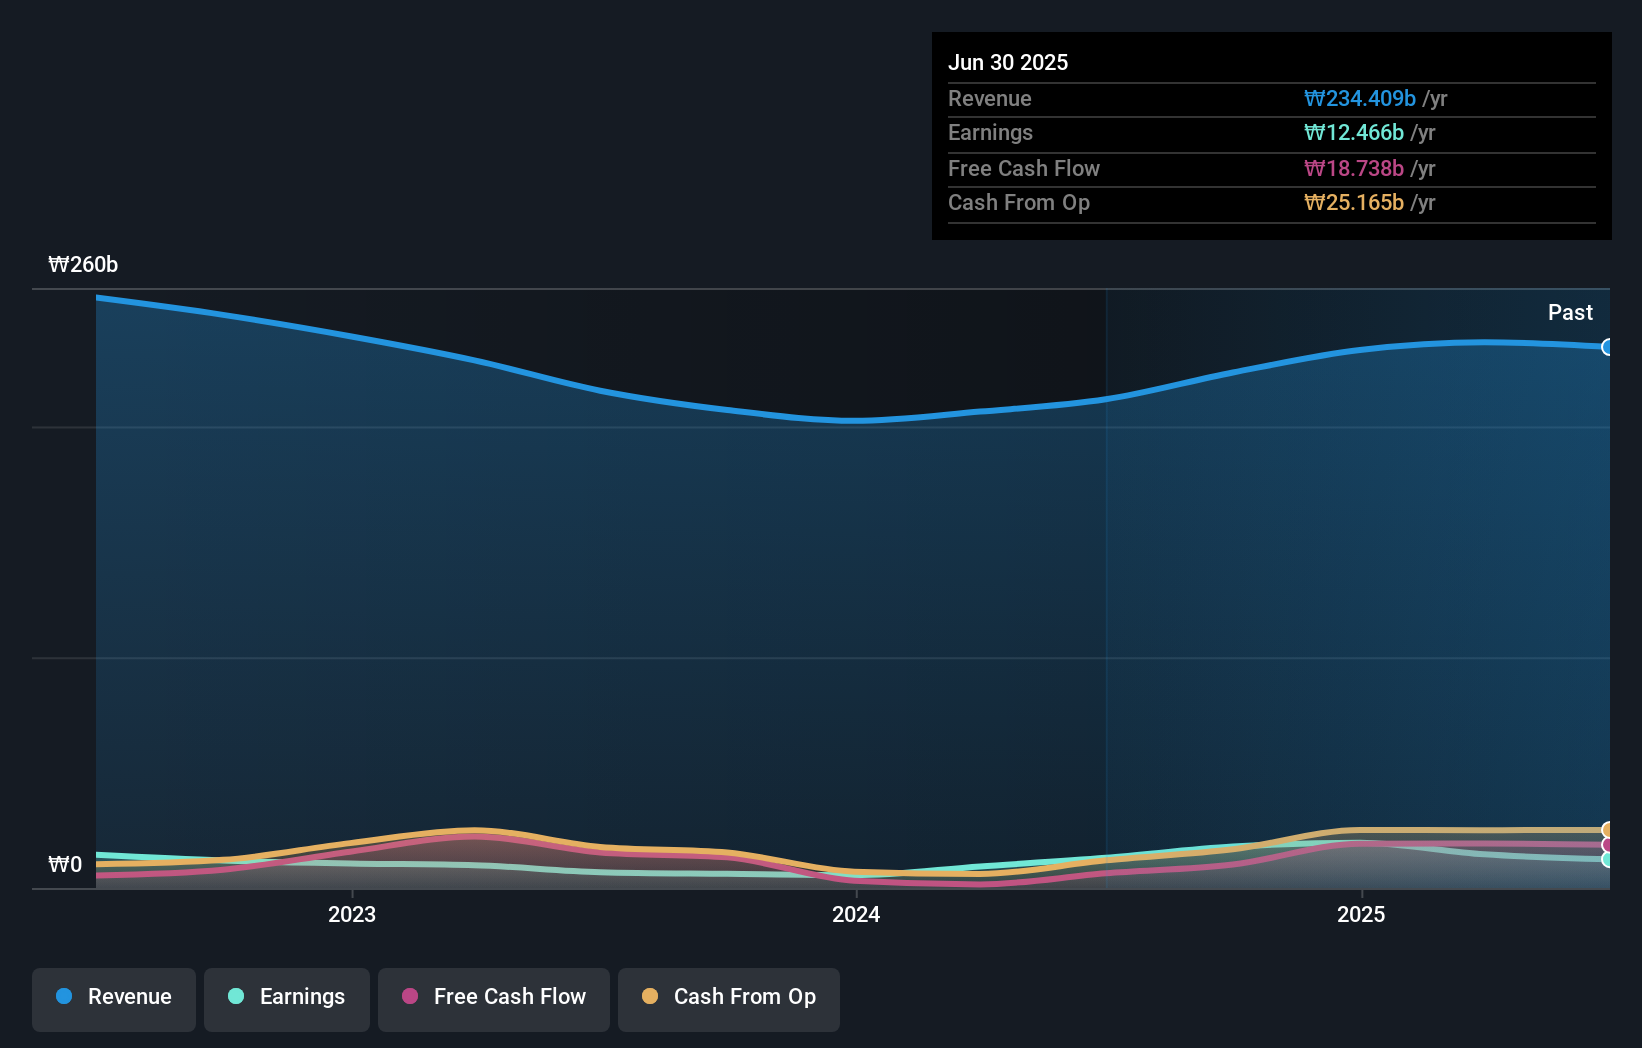
The graphic below depicts how earnings and revenue have changed over time (unveil the exact values by clicking on the image).
Take a more thorough look at Samwha ElectricLtd's financial health with this free report on its balance sheet.
What About Dividends?
When looking at investment returns, it is important to consider the difference between total shareholder return (TSR) and share price return. Whereas the share price return only reflects the change in the share price, the TSR includes the value of dividends (assuming they were reinvested) and the benefit of any discounted capital raising or spin-off. Arguably, the TSR gives a more comprehensive picture of the return generated by a stock. We note that for Samwha ElectricLtd the TSR over the last 3 years was 148%, which is better than the share price return mentioned above. This is largely a result of its dividend payments!
A Different Perspective
Investors in Samwha ElectricLtd had a tough year, with a total loss of 17% (including dividends), against a market gain of about 36%. However, keep in mind that even the best stocks will sometimes underperform the market over a twelve month period. On the bright side, long term shareholders have made money, with a gain of 16% per year over half a decade. It could be that the recent sell-off is an opportunity, so it may be worth checking the fundamental data for signs of a long term growth trend. It's always interesting to track share price performance over the longer term. But to understand Samwha ElectricLtd better, we need to consider many other factors. For example, we've discovered 1 warning sign for Samwha ElectricLtd that you should be aware of before investing here.
But note: Samwha ElectricLtd may not be the best stock to buy. So take a peek at this free list of interesting companies with past earnings growth (and further growth forecast).
Please note, the market returns quoted in this article reflect the market weighted average returns of stocks that currently trade on South Korean exchanges.
New: Manage All Your Stock Portfolios in One Place
We've created the ultimate portfolio companion for stock investors, and it's free.
• Connect an unlimited number of Portfolios and see your total in one currency
• Be alerted to new Warning Signs or Risks via email or mobile
• Track the Fair Value of your stocks
Have feedback on this article? Concerned about the content? Get in touch with us directly. Alternatively, email editorial-team (at) simplywallst.com.
This article by Simply Wall St is general in nature. We provide commentary based on historical data and analyst forecasts only using an unbiased methodology and our articles are not intended to be financial advice. It does not constitute a recommendation to buy or sell any stock, and does not take account of your objectives, or your financial situation. We aim to bring you long-term focused analysis driven by fundamental data. Note that our analysis may not factor in the latest price-sensitive company announcements or qualitative material. Simply Wall St has no position in any stocks mentioned.
About KOSE:A009470
Samwha ElectricLtd
Operates in the electrolytic capacitor industry in South Korea and internationally.
Flawless balance sheet and fair value.
Market Insights

Advertisement
Community Narratives
A formidable player in AI and enterprise computing.
Fair Value US$210.00|3.9% overvalued
CO
Community Contributor
IREN's Bold Moves in Sustainable Bitcoin Mining & AI Data Centers
Fair Value US$72.52|4.1% undervalued
BL
Community Contributor
Cooling the Champions: The Aussie Tech Behind F1's Victories
Fair Value AU$12.40|39.4% undervalued
TR
Community Contributor