- South Korea
- /
- Electronic Equipment and Components
- /
- KOSDAQ:A131400
Does EV Advanced MaterialLtd (KOSDAQ:131400) Have A Healthy Balance Sheet?

Legendary fund manager Li Lu (who Charlie Munger backed) once said, 'The biggest investment risk is not the volatility of prices, but whether you will suffer a permanent loss of capital.' So it seems the smart money knows that debt - which is usually involved in bankruptcies - is a very important factor, when you assess how risky a company is. We note that EV Advanced Material Co.,Ltd (KOSDAQ:131400) does have debt on its balance sheet. But the more important question is: how much risk is that debt creating?
What Risk Does Debt Bring?
Debt and other liabilities become risky for a business when it cannot easily fulfill those obligations, either with free cash flow or by raising capital at an attractive price. Ultimately, if the company can't fulfill its legal obligations to repay debt, shareholders could walk away with nothing. However, a more common (but still painful) scenario is that it has to raise new equity capital at a low price, thus permanently diluting shareholders. Of course, plenty of companies use debt to fund growth, without any negative consequences. The first thing to do when considering how much debt a business uses is to look at its cash and debt together.
What Is EV Advanced MaterialLtd's Debt?
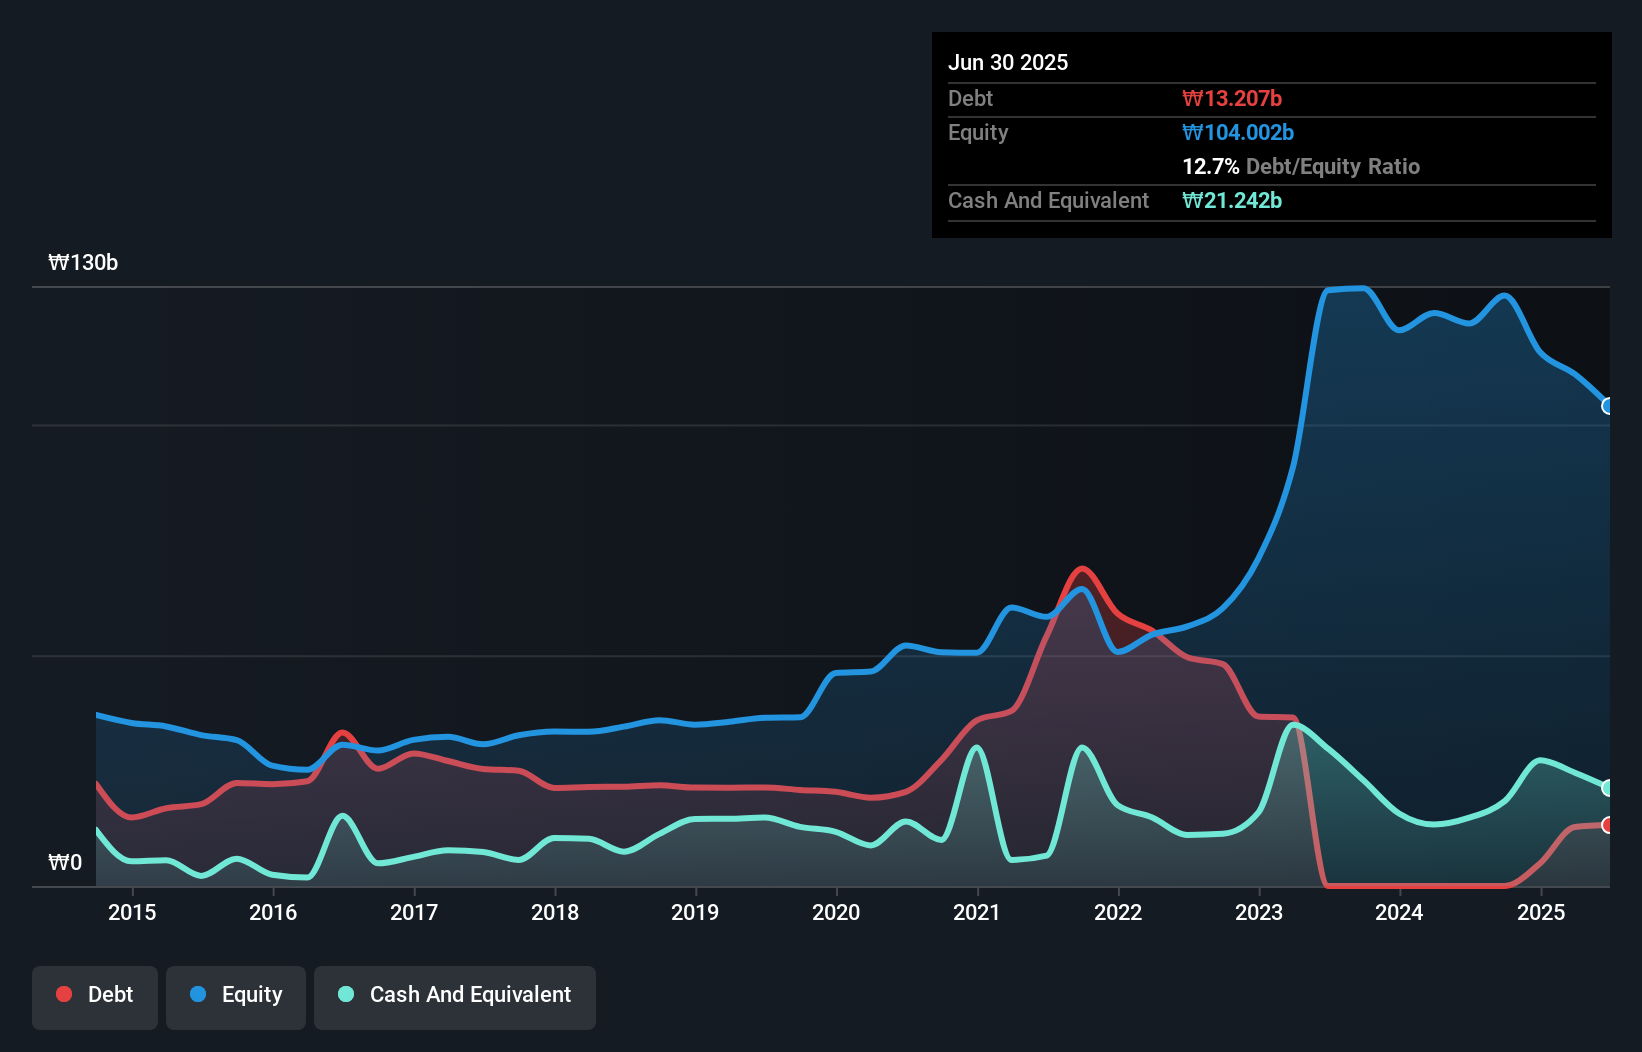
The image below, which you can click on for greater detail, shows that at June 2025 EV Advanced MaterialLtd had debt of ₩13.2b, up from none in one year. But on the other hand it also has ₩21.2b in cash, leading to a ₩8.03b net cash position.
A Look At EV Advanced MaterialLtd's Liabilities
We can see from the most recent balance sheet that EV Advanced MaterialLtd had liabilities of ₩28.0b falling due within a year, and liabilities of ₩7.01b due beyond that. On the other hand, it had cash of ₩21.2b and ₩3.86b worth of receivables due within a year. So its liabilities total ₩9.94b more than the combination of its cash and short-term receivables.
Of course, EV Advanced MaterialLtd has a market capitalization of ₩122.4b, so these liabilities are probably manageable. Having said that, it's clear that we should continue to monitor its balance sheet, lest it change for the worse. While it does have liabilities worth noting, EV Advanced MaterialLtd also has more cash than debt, so we're pretty confident it can manage its debt safely. The balance sheet is clearly the area to focus on when you are analysing debt. But it is EV Advanced MaterialLtd's earnings that will influence how the balance sheet holds up in the future. So when considering debt, it's definitely worth looking at the earnings trend. Click here for an interactive snapshot.
View our latest analysis for EV Advanced MaterialLtd
In the last year EV Advanced MaterialLtd wasn't profitable at an EBIT level, but managed to grow its revenue by 4.0%, to ₩74b. We usually like to see faster growth from unprofitable companies, but each to their own.
So How Risky Is EV Advanced MaterialLtd?
Although EV Advanced MaterialLtd had an earnings before interest and tax (EBIT) loss over the last twelve months, it generated positive free cash flow of ₩10.0b. So although it is loss-making, it doesn't seem to have too much near-term balance sheet risk, keeping in mind the net cash. With revenue growth uninspiring, we'd really need to see some positive EBIT before mustering much enthusiasm for this business. There's no doubt that we learn most about debt from the balance sheet. But ultimately, every company can contain risks that exist outside of the balance sheet. To that end, you should learn about the 3 warning signs we've spotted with EV Advanced MaterialLtd (including 2 which are potentially serious) .
Of course, if you're the type of investor who prefers buying stocks without the burden of debt, then don't hesitate to discover our exclusive list of net cash growth stocks, today.
Mobile Infrastructure for Defense and Disaster
The next wave in robotics isn't humanoid. Its fully autonomous towers delivering 5G, ISR, and radar in under 30 minutes, anywhere.
Get the investor briefing before the next round of contracts
Sponsored On Behalf of CiTechValuation is complex, but we're here to simplify it.
Discover if EV Advanced MaterialLtd might be undervalued or overvalued with our detailed analysis, featuring fair value estimates, potential risks, dividends, insider trades, and its financial condition.
Access Free AnalysisHave feedback on this article? Concerned about the content? Get in touch with us directly. Alternatively, email editorial-team (at) simplywallst.com.
This article by Simply Wall St is general in nature. We provide commentary based on historical data and analyst forecasts only using an unbiased methodology and our articles are not intended to be financial advice. It does not constitute a recommendation to buy or sell any stock, and does not take account of your objectives, or your financial situation. We aim to bring you long-term focused analysis driven by fundamental data. Note that our analysis may not factor in the latest price-sensitive company announcements or qualitative material. Simply Wall St has no position in any stocks mentioned.
About KOSDAQ:A131400
EV Advanced MaterialLtd
Engages in the manufacture and sale of flexible printed circuit boards (FPCBs) in South Korea.
Flawless balance sheet with low risk.
Market Insights

Weekly Picks

THE KINGDOM OF BROWN GOODS: WHY MGPI IS BEING CRUSHED BY INVENTORY & PRIMED FOR RESURRECTION


Why Vertical Aerospace (NYSE: EVTL) is Worth Possibly Over 13x its Current Price


The Quiet Giant That Became AI’s Power Grid
Recently Updated Narratives


A tech powerhouse quietly powering the world’s AI infrastructure.


Keppel DC REIT (SGX: AJBU) is a resilient gem in the data center space.
Why Vertical Aerospace (NYSE: EVTL) is Worth Possibly Over 13x its Current Price
Popular Narratives

MicroVision will explode future revenue by 380.37% with a vision towards success


Crazy Undervalued 42 Baggers Silver Play (Active & Running Mine)


