- South Korea
- /
- Electronic Equipment and Components
- /
- KOSDAQ:A053450
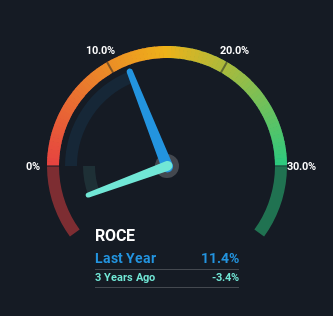
The Return Trends At SEKONIX (KOSDAQ:053450) Look Promising

There are a few key trends to look for if we want to identify the next multi-bagger. Ideally, a business will show two trends; firstly a growing return on capital employed (ROCE) and secondly, an increasing amount of capital employed. Ultimately, this demonstrates that it's a business that is reinvesting profits at increasing rates of return. So when we looked at SEKONIX (KOSDAQ:053450) and its trend of ROCE, we really liked what we saw.
Return On Capital Employed (ROCE): What Is It?
For those that aren't sure what ROCE is, it measures the amount of pre-tax profits a company can generate from the capital employed in its business. Analysts use this formula to calculate it for SEKONIX:
Return on Capital Employed = Earnings Before Interest and Tax (EBIT) ÷ (Total Assets - Current Liabilities)
0.11 = ₩17b ÷ (₩300b - ₩152b) (Based on the trailing twelve months to March 2024).
Thus, SEKONIX has an ROCE of 11%. In absolute terms, that's a satisfactory return, but compared to the Electronic industry average of 6.9% it's much better.
View our latest analysis for SEKONIX
While the past is not representative of the future, it can be helpful to know how a company has performed historically, which is why we have this chart above. If you'd like to look at how SEKONIX has performed in the past in other metrics, you can view this free graph of SEKONIX's past earnings, revenue and cash flow.
What The Trend Of ROCE Can Tell Us
SEKONIX has not disappointed in regards to ROCE growth. The data shows that returns on capital have increased by 266% over the trailing five years. The company is now earning ₩0.1 per dollar of capital employed. Interestingly, the business may be becoming more efficient because it's applying 32% less capital than it was five years ago. If this trend continues, the business might be getting more efficient but it's shrinking in terms of total assets.
On a separate but related note, it's important to know that SEKONIX has a current liabilities to total assets ratio of 50%, which we'd consider pretty high. This effectively means that suppliers (or short-term creditors) are funding a large portion of the business, so just be aware that this can introduce some elements of risk. Ideally we'd like to see this reduce as that would mean fewer obligations bearing risks.
The Bottom Line On SEKONIX's ROCE
From what we've seen above, SEKONIX has managed to increase it's returns on capital all the while reducing it's capital base. Since the total return from the stock has been almost flat over the last five years, there might be an opportunity here if the valuation looks good. That being the case, research into the company's current valuation metrics and future prospects seems fitting.
On a final note, we've found 3 warning signs for SEKONIX that we think you should be aware of.
For those who like to invest in solid companies, check out this free list of companies with solid balance sheets and high returns on equity.
The New Payments ETF Is Live on NASDAQ:
Money is moving to real-time rails, and a newly listed ETF now gives investors direct exposure. Fast settlement. Institutional custody. Simple access.
Explore how this launch could reshape portfolios
Sponsored ContentNew: Manage All Your Stock Portfolios in One Place
We've created the ultimate portfolio companion for stock investors, and it's free.
• Connect an unlimited number of Portfolios and see your total in one currency
• Be alerted to new Warning Signs or Risks via email or mobile
• Track the Fair Value of your stocks
Have feedback on this article? Concerned about the content? Get in touch with us directly. Alternatively, email editorial-team (at) simplywallst.com.
This article by Simply Wall St is general in nature. We provide commentary based on historical data and analyst forecasts only using an unbiased methodology and our articles are not intended to be financial advice. It does not constitute a recommendation to buy or sell any stock, and does not take account of your objectives, or your financial situation. We aim to bring you long-term focused analysis driven by fundamental data. Note that our analysis may not factor in the latest price-sensitive company announcements or qualitative material. Simply Wall St has no position in any stocks mentioned.
Have feedback on this article? Concerned about the content? Get in touch with us directly. Alternatively, email editorial-team@simplywallst.com
About KOSDAQ:A053450
SEKONIX
Develops, manufactures, and sells optical electronic components primarily in South Korea.
Adequate balance sheet and slightly overvalued.
Similar Companies
Market Insights

Weekly Picks

THE KINGDOM OF BROWN GOODS: WHY MGPI IS BEING CRUSHED BY INVENTORY & PRIMED FOR RESURRECTION


Why Vertical Aerospace (NYSE: EVTL) is Worth Possibly Over 13x its Current Price


The Quiet Giant That Became AI’s Power Grid
Recently Updated Narratives


Fiverr International will transform the freelance industry with AI-powered growth

Jackson Financial Stock: When Insurance Math Meets a Shifting Claims Landscape

Stride Stock: Online Education Finds Its Second Act
Popular Narratives


MicroVision will explode future revenue by 380.37% with a vision towards success


Crazy Undervalued 42 Baggers Silver Play (Active & Running Mine)


