
Advertisement
- South Korea
- /
- Communications
- /
- KOSDAQ:A051980
JOONGANG ADVANCED MATERIALS Co., Ltd's (KOSDAQ:051980) Shares Climb 32% But Its Business Is Yet to Catch Up
Despite an already strong run, JOONGANG ADVANCED MATERIALS Co., Ltd (KOSDAQ:051980) shares have been powering on, with a gain of 32% in the last thirty days. Unfortunately, despite the strong performance over the last month, the full year gain of 5.4% isn't as attractive.
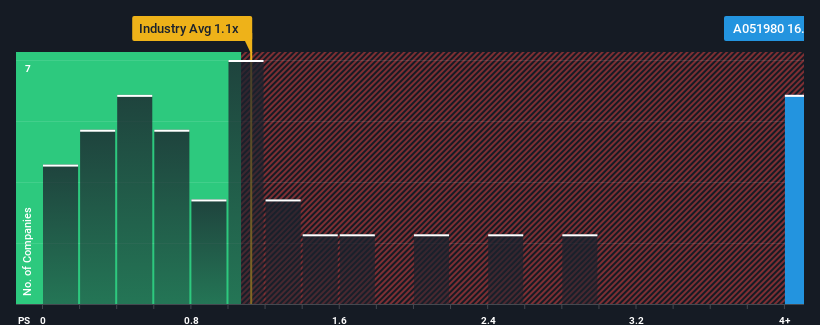
Following the firm bounce in price, when almost half of the companies in Korea's Communications industry have price-to-sales ratios (or "P/S") below 1.1x, you may consider JOONGANG ADVANCED MATERIALS as a stock not worth researching with its 16.3x P/S ratio. Nonetheless, we'd need to dig a little deeper to determine if there is a rational basis for the highly elevated P/S.
See our latest analysis for JOONGANG ADVANCED MATERIALS
How JOONGANG ADVANCED MATERIALS Has Been Performing
For instance, JOONGANG ADVANCED MATERIALS' receding revenue in recent times would have to be some food for thought. It might be that many expect the company to still outplay most other companies over the coming period, which has kept the P/S from collapsing. If not, then existing shareholders may be quite nervous about the viability of the share price.
Although there are no analyst estimates available for JOONGANG ADVANCED MATERIALS, take a look at this free data-rich visualisation to see how the company stacks up on earnings, revenue and cash flow.Do Revenue Forecasts Match The High P/S Ratio?
In order to justify its P/S ratio, JOONGANG ADVANCED MATERIALS would need to produce outstanding growth that's well in excess of the industry.
In reviewing the last year of financials, we were disheartened to see the company's revenues fell to the tune of 1.2%. However, a few very strong years before that means that it was still able to grow revenue by an impressive 144% in total over the last three years. Accordingly, while they would have preferred to keep the run going, shareholders would definitely welcome the medium-term rates of revenue growth.
Weighing that recent medium-term revenue trajectory against the broader industry's one-year forecast for expansion of 34% shows it's about the same on an annualised basis.
In light of this, it's curious that JOONGANG ADVANCED MATERIALS' P/S sits above the majority of other companies. It seems most investors are ignoring the fairly average recent growth rates and are willing to pay up for exposure to the stock. Nevertheless, they may be setting themselves up for future disappointment if the P/S falls to levels more in line with recent growth rates.
The Key Takeaway
The strong share price surge has lead to JOONGANG ADVANCED MATERIALS' P/S soaring as well. Using the price-to-sales ratio alone to determine if you should sell your stock isn't sensible, however it can be a practical guide to the company's future prospects.
Our examination of JOONGANG ADVANCED MATERIALS revealed its three-year revenue trends aren't impacting its high P/S as much as we would have predicted, given they look similar to current industry expectations. Right now we are uncomfortable with the high P/S as this revenue performance isn't likely to support such positive sentiment for long. Unless the recent medium-term conditions improve, it's challenging to accept these prices as being reasonable.
You need to take note of risks, for example - JOONGANG ADVANCED MATERIALS has 4 warning signs (and 3 which are concerning) we think you should know about.
It's important to make sure you look for a great company, not just the first idea you come across. So if growing profitability aligns with your idea of a great company, take a peek at this free list of interesting companies with strong recent earnings growth (and a low P/E).
New: Manage All Your Stock Portfolios in One Place
We've created the ultimate portfolio companion for stock investors, and it's free.
• Connect an unlimited number of Portfolios and see your total in one currency
• Be alerted to new Warning Signs or Risks via email or mobile
• Track the Fair Value of your stocks
Have feedback on this article? Concerned about the content? Get in touch with us directly. Alternatively, email editorial-team (at) simplywallst.com.
This article by Simply Wall St is general in nature. We provide commentary based on historical data and analyst forecasts only using an unbiased methodology and our articles are not intended to be financial advice. It does not constitute a recommendation to buy or sell any stock, and does not take account of your objectives, or your financial situation. We aim to bring you long-term focused analysis driven by fundamental data. Note that our analysis may not factor in the latest price-sensitive company announcements or qualitative material. Simply Wall St has no position in any stocks mentioned.
About KOSDAQ:A051980
JOONGANG ADVANCED MATERIALS
Manufactures and sells windows, doors, light emitting diode lightings, medical devices, plastic products, and ventilation flat ducts in the Middle East, Asia, and internationally.
Flawless balance sheet with very low risk.
Market Insights

Advertisement
Weekly Picks
RO


RockeTeller on Santacruz Silver Mining ·
Crazy Undervalued 42 Baggers Silver Play (Active & Running Mine)
Fair Value:CA$8696.7% undervalued
10 followersusers have followed this narrative
5 commentsusers have commented on this narrative
0 likesusers have liked this narrative
RO


Robbo on Fiducian Group ·
Fiducian: Compliance Clouds or Value Opportunity?
Fair Value:AU$126.3% undervalued
1 followerusers have followed this narrative
0 commentsusers have commented on this narrative
0 likesusers have liked this narrative
WO

woodworthfund on Willamette Valley Vineyards ·
Willamette Valley Vineyards (WVVI): Not-So-Great Value
Fair Value:US$242.5% overvalued
2 followersusers have followed this narrative
0 commentsusers have commented on this narrative
1 likeusers have liked this narrative
Recently Updated Narratives
YE
Yellow_fever on China Starch Holdings ·
China Starch Holdings eyes a revenue growth of 4.66% with a 5-year strategic plan
Fair Value:HK$0.562.8% undervalued
1 followerusers have followed this narrative
0 commentsusers have commented on this narrative
0 likesusers have liked this narrative
CO

composite32 on Power Solutions International ·
PSIX The timing of insider sales is a serious question mark
Fair Value:US$37.3845.7% overvalued
1 followerusers have followed this narrative
0 commentsusers have commented on this narrative
0 likesusers have liked this narrative
TA


Talos on Marvell Technology ·
The Great Strategy Swap – Selling "Old Auto" to Buy "Future Light"
Fair Value:US$155.3740.2% undervalued
1 followerusers have followed this narrative
0 commentsusers have commented on this narrative
0 likesusers have liked this narrative
Popular Narratives
TH


TheWallstreetKing on MicroVision ·
MicroVision will explode future revenue by 380.37% with a vision towards success
Fair Value:US$6098.6% undervalued
112 followersusers have followed this narrative
11 commentsusers have commented on this narrative
22 likesusers have liked this narrative
AN


AnalystConsensusTarget on NVIDIA ·
NVDA: Expanding AI Demand Will Drive Major Data Center Investments Through 2026
Fair Value:US$250.3927.6% undervalued
946 followersusers have followed this narrative
6 commentsusers have commented on this narrative
24 likesusers have liked this narrative
OS


oscargarcia on Alphabet ·
The company that turned a verb into a global necessity and basically runs the modern internet, digital ads, smartphones, maps, and AI.
Fair Value:US$3407.2% undervalued
148 followersusers have followed this narrative
6 commentsusers have commented on this narrative
18 likesusers have liked this narrative
