- South Korea
- /
- Communications
- /
- KOSDAQ:A051980
JOONGANG ADVANCED MATERIALS Co., Ltd (KOSDAQ:051980) May Have Run Too Fast Too Soon With Recent 28% Price Plummet
JOONGANG ADVANCED MATERIALS Co., Ltd (KOSDAQ:051980) shares have had a horrible month, losing 28% after a relatively good period beforehand. Nonetheless, the last 30 days have barely left a scratch on the stock's annual performance, which is up a whopping 315%.
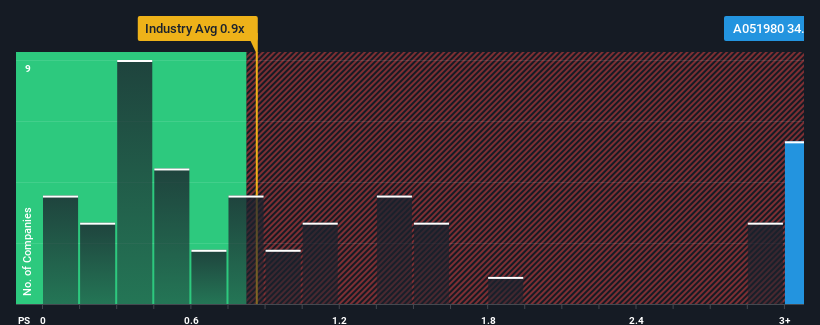
In spite of the heavy fall in price, when almost half of the companies in Korea's Communications industry have price-to-sales ratios (or "P/S") below 0.9x, you may still consider JOONGANG ADVANCED MATERIALS as a stock not worth researching with its 34x P/S ratio. Although, it's not wise to just take the P/S at face value as there may be an explanation why it's so lofty.
View our latest analysis for JOONGANG ADVANCED MATERIALS

How Has JOONGANG ADVANCED MATERIALS Performed Recently?
Revenue has risen at a steady rate over the last year for JOONGANG ADVANCED MATERIALS, which is generally not a bad outcome. It might be that many expect the reasonable revenue performance to beat most other companies over the coming period, which has increased investors’ willingness to pay up for the stock. You'd really hope so, otherwise you're paying a pretty hefty price for no particular reason.
Although there are no analyst estimates available for JOONGANG ADVANCED MATERIALS, take a look at this free data-rich visualisation to see how the company stacks up on earnings, revenue and cash flow.What Are Revenue Growth Metrics Telling Us About The High P/S?
There's an inherent assumption that a company should far outperform the industry for P/S ratios like JOONGANG ADVANCED MATERIALS' to be considered reasonable.
Retrospectively, the last year delivered a decent 4.5% gain to the company's revenues. This was backed up an excellent period prior to see revenue up by 95% in total over the last three years. Therefore, it's fair to say the revenue growth recently has been superb for the company.
Comparing that to the industry, which is predicted to deliver 38% growth in the next 12 months, the company's momentum is weaker, based on recent medium-term annualised revenue results.
With this in mind, we find it worrying that JOONGANG ADVANCED MATERIALS' P/S exceeds that of its industry peers. Apparently many investors in the company are way more bullish than recent times would indicate and aren't willing to let go of their stock at any price. There's a good chance existing shareholders are setting themselves up for future disappointment if the P/S falls to levels more in line with recent growth rates.
What We Can Learn From JOONGANG ADVANCED MATERIALS' P/S?
Even after such a strong price drop, JOONGANG ADVANCED MATERIALS' P/S still exceeds the industry median significantly. While the price-to-sales ratio shouldn't be the defining factor in whether you buy a stock or not, it's quite a capable barometer of revenue expectations.
Our examination of JOONGANG ADVANCED MATERIALS revealed its poor three-year revenue trends aren't detracting from the P/S as much as we though, given they look worse than current industry expectations. Right now we aren't comfortable with the high P/S as this revenue performance isn't likely to support such positive sentiment for long. Unless the recent medium-term conditions improve markedly, it's very challenging to accept these the share price as being reasonable.
Before you take the next step, you should know about the 4 warning signs for JOONGANG ADVANCED MATERIALS (2 shouldn't be ignored!) that we have uncovered.
It's important to make sure you look for a great company, not just the first idea you come across. So if growing profitability aligns with your idea of a great company, take a peek at this free list of interesting companies with strong recent earnings growth (and a low P/E).
New: Manage All Your Stock Portfolios in One Place
We've created the ultimate portfolio companion for stock investors, and it's free.
• Connect an unlimited number of Portfolios and see your total in one currency
• Be alerted to new Warning Signs or Risks via email or mobile
• Track the Fair Value of your stocks
Have feedback on this article? Concerned about the content? Get in touch with us directly. Alternatively, email editorial-team (at) simplywallst.com.
This article by Simply Wall St is general in nature. We provide commentary based on historical data and analyst forecasts only using an unbiased methodology and our articles are not intended to be financial advice. It does not constitute a recommendation to buy or sell any stock, and does not take account of your objectives, or your financial situation. We aim to bring you long-term focused analysis driven by fundamental data. Note that our analysis may not factor in the latest price-sensitive company announcements or qualitative material. Simply Wall St has no position in any stocks mentioned.
About KOSDAQ:A051980
JOONGANG ADVANCED MATERIALS
Manufactures and sells windows, doors, light emitting diode lightings, medical devices, plastic products, and ventilation flat ducts in the Middle East, Asia, and internationally.
Flawless balance sheet with very low risk.
Market Insights
Weekly Picks


Crazy Undervalued 42 Baggers Silver Play (Active & Running Mine)


Fiducian: Compliance Clouds or Value Opportunity?

Willamette Valley Vineyards (WVVI): Not-So-Great Value
Recently Updated Narratives


The Great Strategy Swap – Selling "Old Auto" to Buy "Future Light"


Not a Bubble, But the "Industrial Revolution 4.0" Engine


The "David vs. Goliath" AI Trade – Why Second Place is Worth Billions
Popular Narratives


MicroVision will explode future revenue by 380.37% with a vision towards success


NVDA: Expanding AI Demand Will Drive Major Data Center Investments Through 2026


