- South Korea
- /
- Electronic Equipment and Components
- /
- KOSDAQ:A012340
NuintekLtd (KOSDAQ:012340) Takes On Some Risk With Its Use Of Debt

Warren Buffett famously said, 'Volatility is far from synonymous with risk.' When we think about how risky a company is, we always like to look at its use of debt, since debt overload can lead to ruin. We note that Nuintek Co.,Ltd. (KOSDAQ:012340) does have debt on its balance sheet. But the more important question is: how much risk is that debt creating?
What Risk Does Debt Bring?
Generally speaking, debt only becomes a real problem when a company can't easily pay it off, either by raising capital or with its own cash flow. In the worst case scenario, a company can go bankrupt if it cannot pay its creditors. However, a more frequent (but still costly) occurrence is where a company must issue shares at bargain-basement prices, permanently diluting shareholders, just to shore up its balance sheet. Of course, plenty of companies use debt to fund growth, without any negative consequences. When we think about a company's use of debt, we first look at cash and debt together.
See our latest analysis for NuintekLtd
How Much Debt Does NuintekLtd Carry?
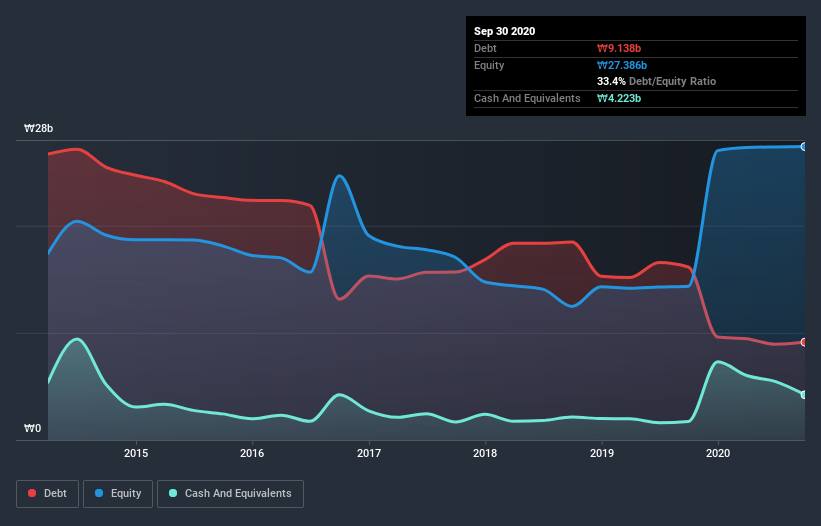
The image below, which you can click on for greater detail, shows that NuintekLtd had debt of ₩8.34b at the end of September 2020, a reduction from ₩16.1b over a year. However, it does have ₩4.22b in cash offsetting this, leading to net debt of about ₩4.11b.
A Look At NuintekLtd's Liabilities
The latest balance sheet data shows that NuintekLtd had liabilities of ₩17.6b due within a year, and liabilities of ₩5.67b falling due after that. On the other hand, it had cash of ₩4.22b and ₩11.1b worth of receivables due within a year. So it has liabilities totalling ₩7.95b more than its cash and near-term receivables, combined.
Given NuintekLtd has a market capitalization of ₩123.2b, it's hard to believe these liabilities pose much threat. However, we do think it is worth keeping an eye on its balance sheet strength, as it may change over time.
We use two main ratios to inform us about debt levels relative to earnings. The first is net debt divided by earnings before interest, tax, depreciation, and amortization (EBITDA), while the second is how many times its earnings before interest and tax (EBIT) covers its interest expense (or its interest cover, for short). This way, we consider both the absolute quantum of the debt, as well as the interest rates paid on it.
Given net debt is only 1.3 times EBITDA, it is initially surprising to see that NuintekLtd's EBIT has low interest coverage of 0.28 times. So one way or the other, it's clear the debt levels are not trivial. We also note that NuintekLtd improved its EBIT from a last year's loss to a positive ₩219m. When analysing debt levels, the balance sheet is the obvious place to start. But you can't view debt in total isolation; since NuintekLtd will need earnings to service that debt. So if you're keen to discover more about its earnings, it might be worth checking out this graph of its long term earnings trend.
Finally, while the tax-man may adore accounting profits, lenders only accept cold hard cash. So it is important to check how much of its earnings before interest and tax (EBIT) converts to actual free cash flow. During the last year, NuintekLtd burned a lot of cash. While that may be a result of expenditure for growth, it does make the debt far more risky.
Our View
While NuintekLtd's interest cover makes us cautious about it, its track record of converting EBIT to free cash flow is no better. But its not so bad at managing its debt, based on its EBITDA,. When we consider all the factors discussed, it seems to us that NuintekLtd is taking some risks with its use of debt. While that debt can boost returns, we think the company has enough leverage now. There's no doubt that we learn most about debt from the balance sheet. But ultimately, every company can contain risks that exist outside of the balance sheet. To that end, you should be aware of the 2 warning signs we've spotted with NuintekLtd .
At the end of the day, it's often better to focus on companies that are free from net debt. You can access our special list of such companies (all with a track record of profit growth). It's free.
If you’re looking to trade NuintekLtd, open an account with the lowest-cost* platform trusted by professionals, Interactive Brokers. Their clients from over 200 countries and territories trade stocks, options, futures, forex, bonds and funds worldwide from a single integrated account. Promoted
Mobile Infrastructure for Defense and Disaster
The next wave in robotics isn't humanoid. Its fully autonomous towers delivering 5G, ISR, and radar in under 30 minutes, anywhere.
Get the investor briefing before the next round of contracts
Sponsored On Behalf of CiTechValuation is complex, but we're here to simplify it.
Discover if NuintekLtd might be undervalued or overvalued with our detailed analysis, featuring fair value estimates, potential risks, dividends, insider trades, and its financial condition.
Access Free AnalysisThis article by Simply Wall St is general in nature. It does not constitute a recommendation to buy or sell any stock, and does not take account of your objectives, or your financial situation. We aim to bring you long-term focused analysis driven by fundamental data. Note that our analysis may not factor in the latest price-sensitive company announcements or qualitative material. Simply Wall St has no position in any stocks mentioned.
*Interactive Brokers Rated Lowest Cost Broker by StockBrokers.com Annual Online Review 2020
Have feedback on this article? Concerned about the content? Get in touch with us directly. Alternatively, email editorial-team (at) simplywallst.com.
About KOSDAQ:A012340
NuintekLtd
Manufactures and sells film capacitors and metallized capacitor films worldwide.
Mediocre balance sheet with low risk.
Market Insights

Weekly Picks

Early mover in a fast growing industry. Likely to experience share price volatility as they scale


A case for CA$31.80 (undiluted), aka 8,616% upside from CA$0.37 (an 86 bagger!).


Moderation and Stabilisation: HOLD: Fair Price based on a 4-year Cycle is $12.08
Recently Updated Narratives

Amazon: Why the World’s Biggest Platform Still Runs on Invisible Economics

Sunrun Stock: When the Energy Transition Collides With the Cost of Capital

Salesforce Stock: AI-Fueled Growth Is Real — But Can Margins Stay This Strong?
Popular Narratives


MicroVision will explode future revenue by 380.37% with a vision towards success


Crazy Undervalued 42 Baggers Silver Play (Active & Running Mine)


