
Advertisement
- South Korea
- /
- IT
- /
- KOSE:A018260
Samsung SDS' (KRX:018260) investors will be pleased with their respectable 55% return over the last three years
Investors can buy low cost index fund if they want to receive the average market return. But in any diversified portfolio of stocks, you'll see some that fall short of the average. That's what has happened with the Samsung SDS Co., Ltd. (KRX:018260) share price. It's up 46% over three years, but that is below the market return. In the last year the stock has gained 12%.
So let's investigate and see if the longer term performance of the company has been in line with the underlying business' progress.
While markets are a powerful pricing mechanism, share prices reflect investor sentiment, not just underlying business performance. One flawed but reasonable way to assess how sentiment around a company has changed is to compare the earnings per share (EPS) with the share price.
During the three years of share price growth, Samsung SDS actually saw its earnings per share (EPS) drop 0.4% per year.
Given the share price resilience, we don't think the (declining) EPS numbers are a good measure of how the business is moving forward, right now. So other metrics may hold the key to understanding what is influencing investors.
Languishing at just 1.7%, we doubt the dividend is doing much to prop up the share price. You can only imagine how long term shareholders feel about the declining revenue trend (slipping at 7.9% per year). The only thing that's clear is there is low correlation between Samsung SDS' share price and its historic fundamental data. Further research may be required!
The company's revenue and earnings (over time) are depicted in the image below (click to see the exact numbers).
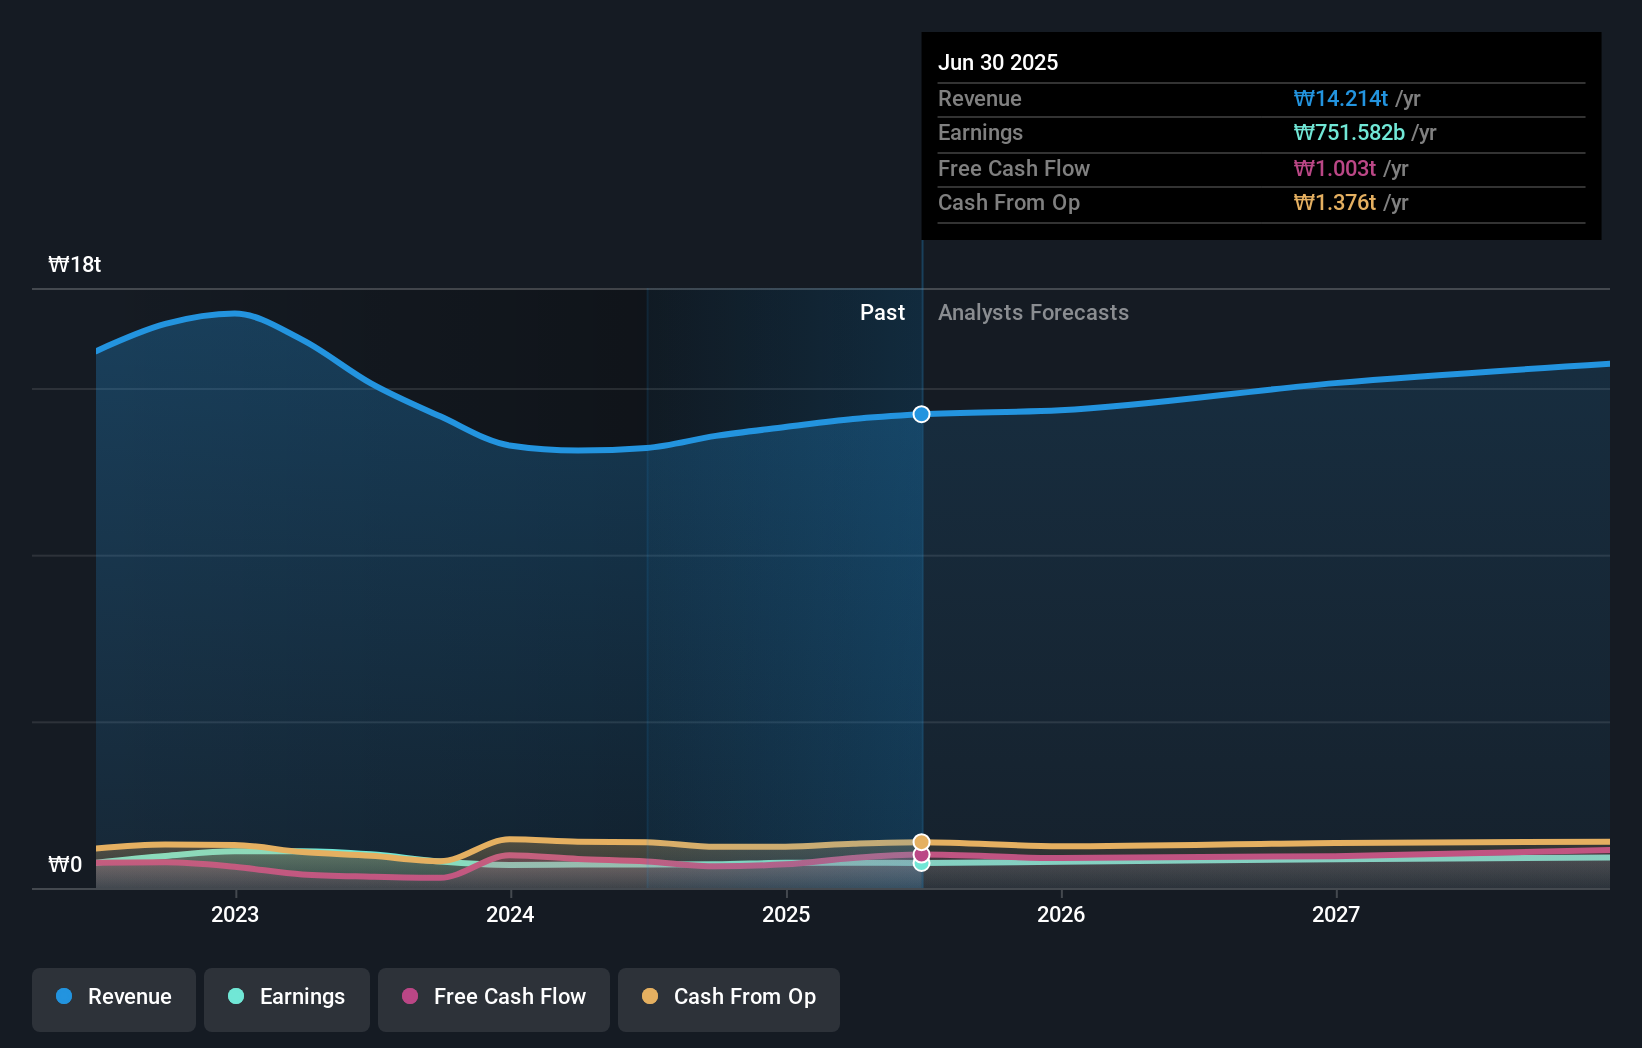
Samsung SDS is a well known stock, with plenty of analyst coverage, suggesting some visibility into future growth. So it makes a lot of sense to check out what analysts think Samsung SDS will earn in the future (free analyst consensus estimates)
What About Dividends?
As well as measuring the share price return, investors should also consider the total shareholder return (TSR). The TSR is a return calculation that accounts for the value of cash dividends (assuming that any dividend received was reinvested) and the calculated value of any discounted capital raisings and spin-offs. So for companies that pay a generous dividend, the TSR is often a lot higher than the share price return. As it happens, Samsung SDS' TSR for the last 3 years was 55%, which exceeds the share price return mentioned earlier. The dividends paid by the company have thusly boosted the total shareholder return.
A Different Perspective
Samsung SDS shareholders are up 15% for the year (even including dividends). But that return falls short of the market. The silver lining is that the gain was actually better than the average annual return of 1.1% per year over five year. This suggests the company might be improving over time. Before forming an opinion on Samsung SDS you might want to consider these 3 valuation metrics.
We will like Samsung SDS better if we see some big insider buys. While we wait, check out this free list of undervalued stocks (mostly small caps) with considerable, recent, insider buying.
Please note, the market returns quoted in this article reflect the market weighted average returns of stocks that currently trade on South Korean exchanges.
New: Manage All Your Stock Portfolios in One Place
We've created the ultimate portfolio companion for stock investors, and it's free.
• Connect an unlimited number of Portfolios and see your total in one currency
• Be alerted to new Warning Signs or Risks via email or mobile
• Track the Fair Value of your stocks
Have feedback on this article? Concerned about the content? Get in touch with us directly. Alternatively, email editorial-team (at) simplywallst.com.
This article by Simply Wall St is general in nature. We provide commentary based on historical data and analyst forecasts only using an unbiased methodology and our articles are not intended to be financial advice. It does not constitute a recommendation to buy or sell any stock, and does not take account of your objectives, or your financial situation. We aim to bring you long-term focused analysis driven by fundamental data. Note that our analysis may not factor in the latest price-sensitive company announcements or qualitative material. Simply Wall St has no position in any stocks mentioned.
About KOSE:A018260
Samsung SDS
Provides cloud and digital logistics platform-based logistics services in South Korea, China, rest of Asia, the United States, Europe, and Africa.
Flawless balance sheet and undervalued.
Similar Companies
Market Insights

Advertisement
Community Narratives
Kodiak AI - a potential 100 bagger opportunity?
Fair Value US$14.00|44.7% undervalued
DA
Community Contributor
A Fair Price for a Great Business Facing Real Threats
Fair Value US$383.06|13.0% undervalued
IM
Community Contributor
AXON And Shopify Integration Will Unlock Global Mobile Advertising
Fair Value US$646.30|0% overvalued
AN
Based on Analyst Price Targets