
Some say volatility, rather than debt, is the best way to think about risk as an investor, but Warren Buffett famously said that 'Volatility is far from synonymous with risk.' So it might be obvious that you need to consider debt, when you think about how risky any given stock is, because too much debt can sink a company. As with many other companies Sandoll Inc. (KOSDAQ:419120) makes use of debt. But is this debt a concern to shareholders?
Why Does Debt Bring Risk?
Debt and other liabilities become risky for a business when it cannot easily fulfill those obligations, either with free cash flow or by raising capital at an attractive price. Part and parcel of capitalism is the process of 'creative destruction' where failed businesses are mercilessly liquidated by their bankers. However, a more usual (but still expensive) situation is where a company must dilute shareholders at a cheap share price simply to get debt under control. Having said that, the most common situation is where a company manages its debt reasonably well - and to its own advantage. When we examine debt levels, we first consider both cash and debt levels, together.
Check out our latest analysis for Sandoll
How Much Debt Does Sandoll Carry?
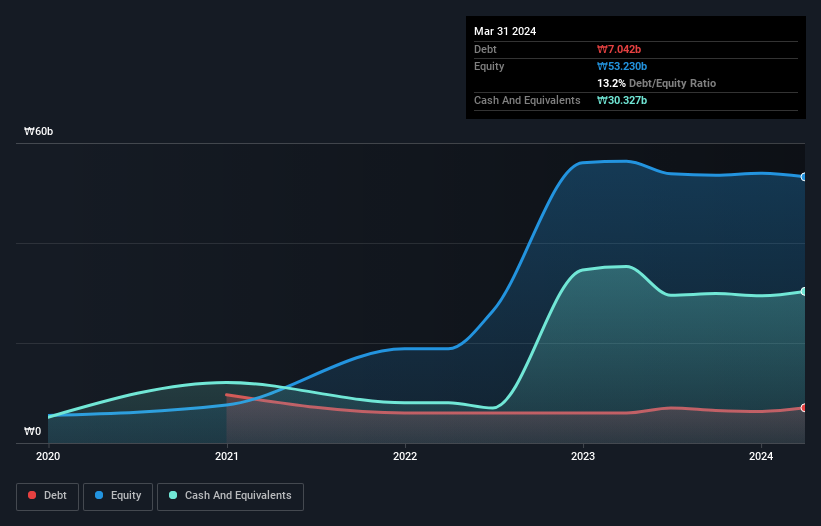
You can click the graphic below for the historical numbers, but it shows that as of March 2024 Sandoll had ₩7.04b of debt, an increase on ₩6.00b, over one year. However, it does have ₩30.3b in cash offsetting this, leading to net cash of ₩23.3b.
How Healthy Is Sandoll's Balance Sheet?
We can see from the most recent balance sheet that Sandoll had liabilities of ₩6.97b falling due within a year, and liabilities of ₩5.77b due beyond that. Offsetting these obligations, it had cash of ₩30.3b as well as receivables valued at ₩692.0m due within 12 months. So it actually has ₩18.3b more liquid assets than total liabilities.
This excess liquidity is a great indication that Sandoll's balance sheet is almost as strong as Fort Knox. Having regard to this fact, we think its balance sheet is as strong as an ox. Succinctly put, Sandoll boasts net cash, so it's fair to say it does not have a heavy debt load!
In fact Sandoll's saving grace is its low debt levels, because its EBIT has tanked 74% in the last twelve months. When it comes to paying off debt, falling earnings are no more useful than sugary sodas are for your health. There's no doubt that we learn most about debt from the balance sheet. But it is Sandoll's earnings that will influence how the balance sheet holds up in the future. So if you're keen to discover more about its earnings, it might be worth checking out this graph of its long term earnings trend.
Finally, a company can only pay off debt with cold hard cash, not accounting profits. Sandoll may have net cash on the balance sheet, but it is still interesting to look at how well the business converts its earnings before interest and tax (EBIT) to free cash flow, because that will influence both its need for, and its capacity to manage debt. During the last three years, Sandoll produced sturdy free cash flow equating to 66% of its EBIT, about what we'd expect. This cold hard cash means it can reduce its debt when it wants to.
Summing Up
While we empathize with investors who find debt concerning, you should keep in mind that Sandoll has net cash of ₩23.3b, as well as more liquid assets than liabilities. The cherry on top was that in converted 66% of that EBIT to free cash flow, bringing in ₩2.9b. So we are not troubled with Sandoll's debt use. When analysing debt levels, the balance sheet is the obvious place to start. But ultimately, every company can contain risks that exist outside of the balance sheet. These risks can be hard to spot. Every company has them, and we've spotted 4 warning signs for Sandoll you should know about.
If, after all that, you're more interested in a fast growing company with a rock-solid balance sheet, then check out our list of net cash growth stocks without delay.
Mobile Infrastructure for Defense and Disaster
The next wave in robotics isn't humanoid. Its fully autonomous towers delivering 5G, ISR, and radar in under 30 minutes, anywhere.
Get the investor briefing before the next round of contracts
Sponsored On Behalf of CiTechNew: Manage All Your Stock Portfolios in One Place
We've created the ultimate portfolio companion for stock investors, and it's free.
• Connect an unlimited number of Portfolios and see your total in one currency
• Be alerted to new Warning Signs or Risks via email or mobile
• Track the Fair Value of your stocks
Have feedback on this article? Concerned about the content? Get in touch with us directly. Alternatively, email editorial-team (at) simplywallst.com.
This article by Simply Wall St is general in nature. We provide commentary based on historical data and analyst forecasts only using an unbiased methodology and our articles are not intended to be financial advice. It does not constitute a recommendation to buy or sell any stock, and does not take account of your objectives, or your financial situation. We aim to bring you long-term focused analysis driven by fundamental data. Note that our analysis may not factor in the latest price-sensitive company announcements or qualitative material. Simply Wall St has no position in any stocks mentioned.
Have feedback on this article? Concerned about the content? Get in touch with us directly. Alternatively, email editorial-team@simplywallst.com
About KOSDAQ:A419120
Sandoll
Engages in the software development and supply business in Korea.
Flawless balance sheet and good value.
Market Insights

Weekly Picks

THE KINGDOM OF BROWN GOODS: WHY MGPI IS BEING CRUSHED BY INVENTORY & PRIMED FOR RESURRECTION


Why Vertical Aerospace (NYSE: EVTL) is Worth Possibly Over 13x its Current Price


The Quiet Giant That Became AI’s Power Grid
Recently Updated Narratives
Why Vertical Aerospace (NYSE: EVTL) is Worth Possibly Over 13x its Current Price

Deep Value Multi Bagger Opportunity


A case for CA$31.80 (undiluted), aka 8,616% upside from CA$0.37 (an 86 bagger!).
Popular Narratives


MicroVision will explode future revenue by 380.37% with a vision towards success


Crazy Undervalued 42 Baggers Silver Play (Active & Running Mine)


NVDA: Expanding AI Demand Will Drive Major Data Center Investments Through 2026
Trending Discussion


