
Advertisement
- South Korea
- /
- Software
- /
- KOSDAQ:A205100
Is EXEM Co., Ltd.'s (KOSDAQ:205100) Recent Stock Performance Influenced By Its Fundamentals In Any Way?
EXEM's (KOSDAQ:205100) stock is up by a considerable 12% over the past week. As most would know, fundamentals are what usually guide market price movements over the long-term, so we decided to look at the company's key financial indicators today to determine if they have any role to play in the recent price movement. Specifically, we decided to study EXEM's ROE in this article.
Return on equity or ROE is an important factor to be considered by a shareholder because it tells them how effectively their capital is being reinvested. In simpler terms, it measures the profitability of a company in relation to shareholder's equity.
See our latest analysis for EXEM
How Do You Calculate Return On Equity?
The formula for return on equity is:
Return on Equity = Net Profit (from continuing operations) ÷ Shareholders' Equity
So, based on the above formula, the ROE for EXEM is:
8.8% = ₩10b ÷ ₩119b (Based on the trailing twelve months to December 2023).
The 'return' is the profit over the last twelve months. So, this means that for every ₩1 of its shareholder's investments, the company generates a profit of ₩0.09.
What Is The Relationship Between ROE And Earnings Growth?
We have already established that ROE serves as an efficient profit-generating gauge for a company's future earnings. Based on how much of its profits the company chooses to reinvest or "retain", we are then able to evaluate a company's future ability to generate profits. Assuming all else is equal, companies that have both a higher return on equity and higher profit retention are usually the ones that have a higher growth rate when compared to companies that don't have the same features.
A Side By Side comparison of EXEM's Earnings Growth And 8.8% ROE
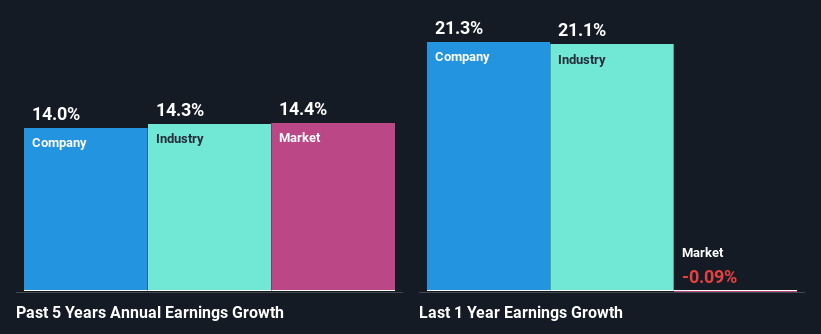
On the face of it, EXEM's ROE is not much to talk about. Yet, a closer study shows that the company's ROE is similar to the industry average of 8.4%. On the other hand, EXEM reported a moderate 14% net income growth over the past five years. Taking into consideration that the ROE is not particularly high, we reckon that there could also be other factors at play which could be influencing the company's growth. For instance, the company has a low payout ratio or is being managed efficiently.
We then performed a comparison between EXEM's net income growth with the industry, which revealed that the company's growth is similar to the average industry growth of 14% in the same 5-year period.
The basis for attaching value to a company is, to a great extent, tied to its earnings growth. What investors need to determine next is if the expected earnings growth, or the lack of it, is already built into the share price. This then helps them determine if the stock is placed for a bright or bleak future. If you're wondering about EXEM's's valuation, check out this gauge of its price-to-earnings ratio, as compared to its industry.
Is EXEM Efficiently Re-investing Its Profits?
Given that EXEM doesn't pay any regular dividends to its shareholders, we infer that the company has been reinvesting all of its profits to grow its business.
Summary
On the whole, we do feel that EXEM has some positive attributes. Despite its low rate of return, the fact that the company reinvests a very high portion of its profits into its business, no doubt contributed to its high earnings growth. While we won't completely dismiss the company, what we would do, is try to ascertain how risky the business is to make a more informed decision around the company. To know the 1 risk we have identified for EXEM visit our risks dashboard for free.
Valuation is complex, but we're here to simplify it.
Discover if EXEM might be undervalued or overvalued with our detailed analysis, featuring fair value estimates, potential risks, dividends, insider trades, and its financial condition.
Access Free AnalysisHave feedback on this article? Concerned about the content? Get in touch with us directly. Alternatively, email editorial-team (at) simplywallst.com.
This article by Simply Wall St is general in nature. We provide commentary based on historical data and analyst forecasts only using an unbiased methodology and our articles are not intended to be financial advice. It does not constitute a recommendation to buy or sell any stock, and does not take account of your objectives, or your financial situation. We aim to bring you long-term focused analysis driven by fundamental data. Note that our analysis may not factor in the latest price-sensitive company announcements or qualitative material. Simply Wall St has no position in any stocks mentioned.
About KOSDAQ:A205100
EXEM
Operates as an IT performance management and big data platform company Korea and internationally.
Flawless balance sheet with proven track record.
Market Insights

Advertisement
Community Narratives
A formidable player in AI and enterprise computing.
Fair Value US$210.00|12.2% overvalued
CO
Community Contributor
IREN's Bold Moves in Sustainable Bitcoin Mining & AI Data Centers
Fair Value US$72.52|17.1% undervalued
BL
Community Contributor
Cooling the Champions: The Aussie Tech Behind F1's Victories
Fair Value AU$12.40|38.7% undervalued
TR
Community Contributor