- South Korea
- /
- Software
- /
- KOSDAQ:A057680
T Scientific Co.,Ltd. (KOSDAQ:057680) Stock Rockets 25% But Many Are Still Ignoring The Company

T Scientific Co.,Ltd. (KOSDAQ:057680) shares have continued their recent momentum with a 25% gain in the last month alone. Longer-term shareholders would be thankful for the recovery in the share price since it's now virtually flat for the year after the recent bounce.
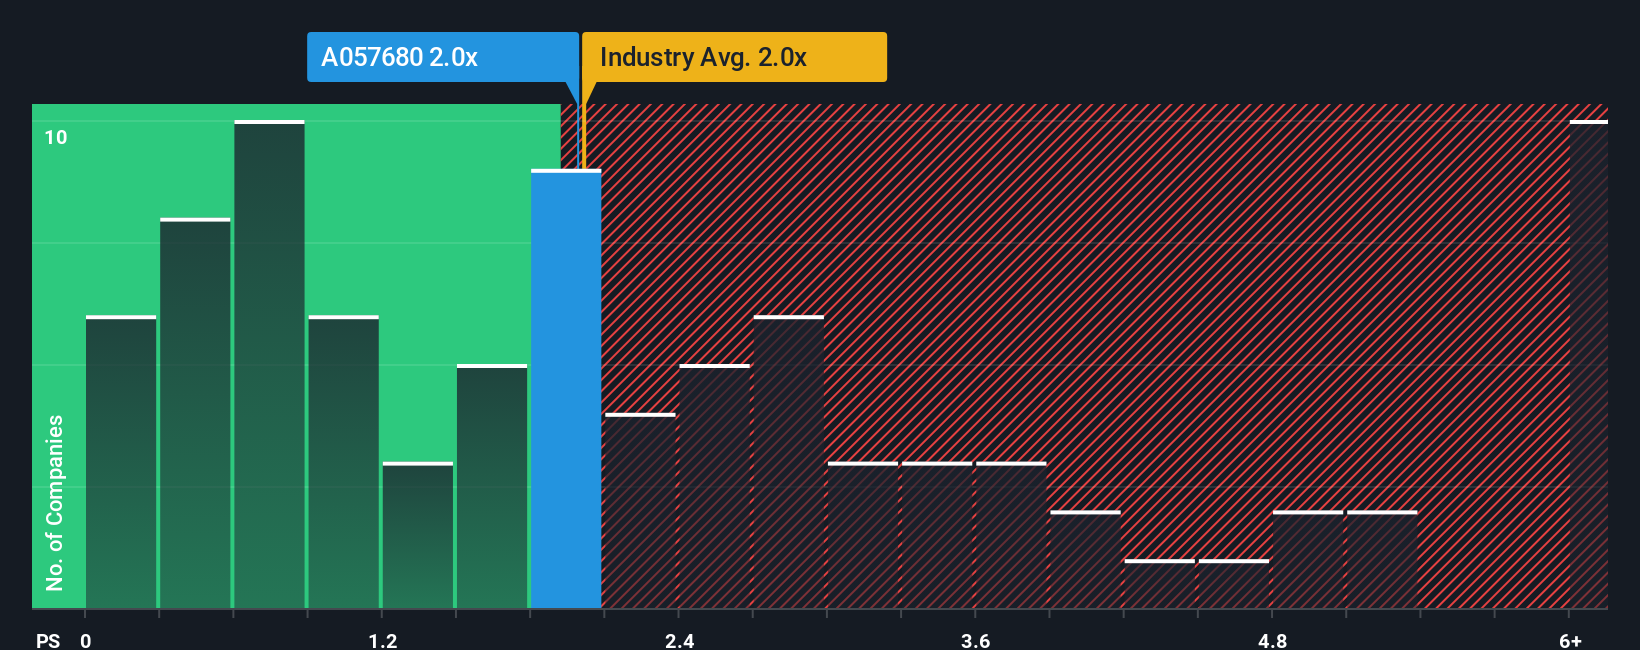
Even after such a large jump in price, there still wouldn't be many who think T ScientificLtd's price-to-sales (or "P/S") ratio of 2x is worth a mention when it essentially matches the median P/S in Korea's Software industry. Although, it's not wise to simply ignore the P/S without explanation as investors may be disregarding a distinct opportunity or a costly mistake.
Check out our latest analysis for T ScientificLtd
What Does T ScientificLtd's P/S Mean For Shareholders?
The revenue growth achieved at T ScientificLtd over the last year would be more than acceptable for most companies. One possibility is that the P/S is moderate because investors think this respectable revenue growth might not be enough to outperform the broader industry in the near future. If that doesn't eventuate, then existing shareholders probably aren't too pessimistic about the future direction of the share price.
We don't have analyst forecasts, but you can see how recent trends are setting up the company for the future by checking out our free report on T ScientificLtd's earnings, revenue and cash flow.Is There Some Revenue Growth Forecasted For T ScientificLtd?
There's an inherent assumption that a company should be matching the industry for P/S ratios like T ScientificLtd's to be considered reasonable.
If we review the last year of revenue growth, the company posted a terrific increase of 29%. This great performance means it was also able to deliver immense revenue growth over the last three years. Therefore, it's fair to say the revenue growth recently has been superb for the company.
Comparing that to the industry, which is only predicted to deliver 13% growth in the next 12 months, the company's momentum is stronger based on recent medium-term annualised revenue results.
In light of this, it's curious that T ScientificLtd's P/S sits in line with the majority of other companies. Apparently some shareholders believe the recent performance is at its limits and have been accepting lower selling prices.

What Does T ScientificLtd's P/S Mean For Investors?
T ScientificLtd appears to be back in favour with a solid price jump bringing its P/S back in line with other companies in the industry While the price-to-sales ratio shouldn't be the defining factor in whether you buy a stock or not, it's quite a capable barometer of revenue expectations.
We didn't quite envision T ScientificLtd's P/S sitting in line with the wider industry, considering the revenue growth over the last three-year is higher than the current industry outlook. There could be some unobserved threats to revenue preventing the P/S ratio from matching this positive performance. It appears some are indeed anticipating revenue instability, because the persistence of these recent medium-term conditions would normally provide a boost to the share price.
You need to take note of risks, for example - T ScientificLtd has 2 warning signs (and 1 which is concerning) we think you should know about.
If these risks are making you reconsider your opinion on T ScientificLtd, explore our interactive list of high quality stocks to get an idea of what else is out there.
The New Payments ETF Is Live on NASDAQ:
Money is moving to real-time rails, and a newly listed ETF now gives investors direct exposure. Fast settlement. Institutional custody. Simple access.
Explore how this launch could reshape portfolios
Sponsored ContentValuation is complex, but we're here to simplify it.
Discover if T ScientificLtd might be undervalued or overvalued with our detailed analysis, featuring fair value estimates, potential risks, dividends, insider trades, and its financial condition.
Access Free AnalysisHave feedback on this article? Concerned about the content? Get in touch with us directly. Alternatively, email editorial-team (at) simplywallst.com.
This article by Simply Wall St is general in nature. We provide commentary based on historical data and analyst forecasts only using an unbiased methodology and our articles are not intended to be financial advice. It does not constitute a recommendation to buy or sell any stock, and does not take account of your objectives, or your financial situation. We aim to bring you long-term focused analysis driven by fundamental data. Note that our analysis may not factor in the latest price-sensitive company announcements or qualitative material. Simply Wall St has no position in any stocks mentioned.
About KOSDAQ:A057680
T ScientificLtd
Engages in the IT and mobile commerce businesses in South Korea.
Flawless balance sheet and slightly overvalued.
Market Insights

Weekly Picks

THE KINGDOM OF BROWN GOODS: WHY MGPI IS BEING CRUSHED BY INVENTORY & PRIMED FOR RESURRECTION


Why Vertical Aerospace (NYSE: EVTL) is Worth Possibly Over 13x its Current Price


The Quiet Giant That Became AI’s Power Grid
Recently Updated Narratives
Why Vertical Aerospace (NYSE: EVTL) is Worth Possibly Over 13x its Current Price

Deep Value Multi Bagger Opportunity


A case for CA$31.80 (undiluted), aka 8,616% upside from CA$0.37 (an 86 bagger!).
Popular Narratives


MicroVision will explode future revenue by 380.37% with a vision towards success


Crazy Undervalued 42 Baggers Silver Play (Active & Running Mine)


NVDA: Expanding AI Demand Will Drive Major Data Center Investments Through 2026
Trending Discussion


