
It's not a stretch to say that T Scientific Co.,Ltd.'s (KOSDAQ:057680) price-to-sales (or "P/S") ratio of 2.1x seems quite "middle-of-the-road" for Software companies in Korea, seeing as it matches the P/S ratio of the wider industry. However, investors might be overlooking a clear opportunity or potential setback if there is no rational basis for the P/S.
Check out our latest analysis for T ScientificLtd
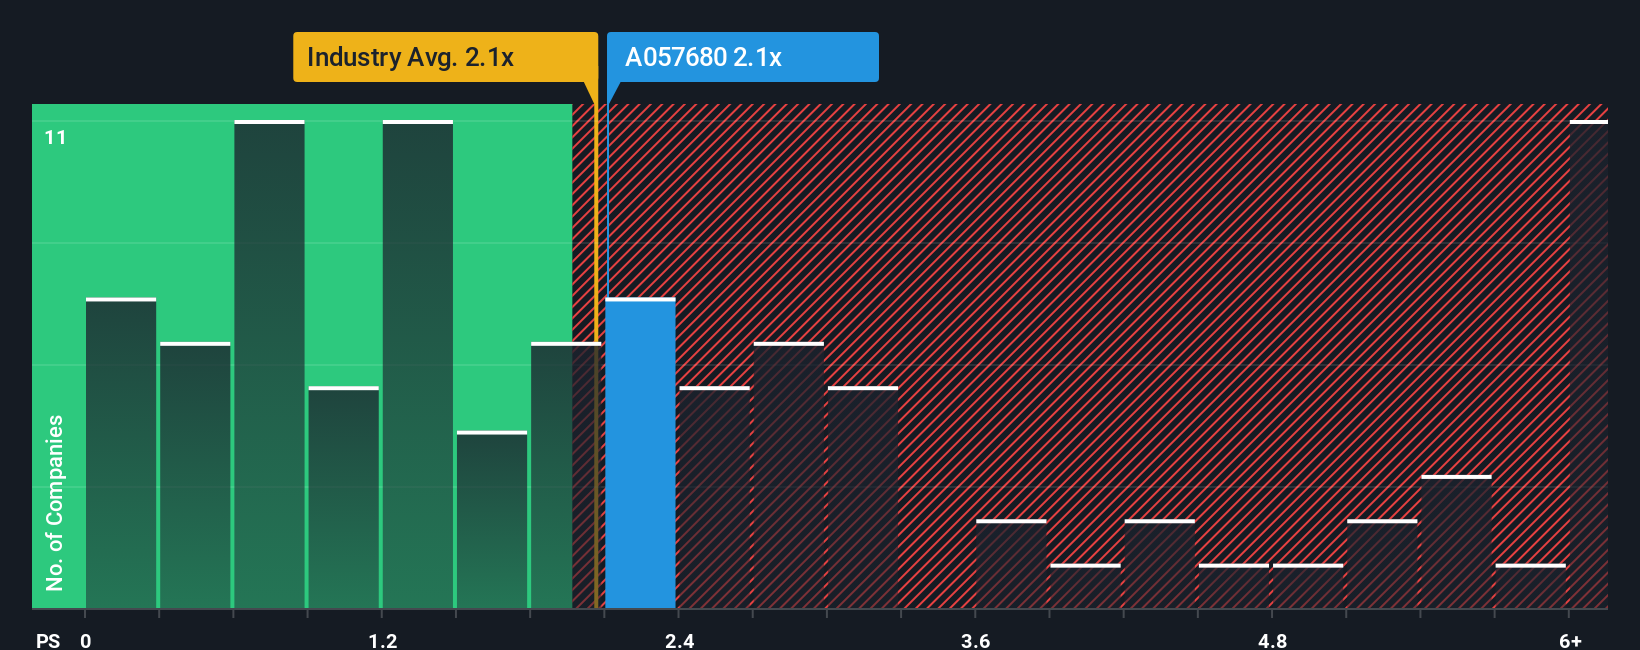
How T ScientificLtd Has Been Performing
Revenue has risen firmly for T ScientificLtd recently, which is pleasing to see. It might be that many expect the respectable revenue performance to wane, which has kept the P/S from rising. If that doesn't eventuate, then existing shareholders probably aren't too pessimistic about the future direction of the share price.
We don't have analyst forecasts, but you can see how recent trends are setting up the company for the future by checking out our free report on T ScientificLtd's earnings, revenue and cash flow.Do Revenue Forecasts Match The P/S Ratio?
There's an inherent assumption that a company should be matching the industry for P/S ratios like T ScientificLtd's to be considered reasonable.
If we review the last year of revenue growth, the company posted a worthy increase of 15%. The latest three year period has also seen an excellent 297% overall rise in revenue, aided somewhat by its short-term performance. Therefore, it's fair to say the revenue growth recently has been superb for the company.
Comparing that recent medium-term revenue trajectory with the industry's one-year growth forecast of 15% shows it's noticeably more attractive.
With this information, we find it interesting that T ScientificLtd is trading at a fairly similar P/S compared to the industry. Apparently some shareholders believe the recent performance is at its limits and have been accepting lower selling prices.
The Key Takeaway
Generally, our preference is to limit the use of the price-to-sales ratio to establishing what the market thinks about the overall health of a company.
We've established that T ScientificLtd currently trades on a lower than expected P/S since its recent three-year growth is higher than the wider industry forecast. It'd be fair to assume that potential risks the company faces could be the contributing factor to the lower than expected P/S. While recent revenue trends over the past medium-term suggest that the risk of a price decline is low, investors appear to see the likelihood of revenue fluctuations in the future.
Before you take the next step, you should know about the 3 warning signs for T ScientificLtd (1 is a bit concerning!) that we have uncovered.
Of course, profitable companies with a history of great earnings growth are generally safer bets. So you may wish to see this free collection of other companies that have reasonable P/E ratios and have grown earnings strongly.
The New Payments ETF Is Live on NASDAQ:
Money is moving to real-time rails, and a newly listed ETF now gives investors direct exposure. Fast settlement. Institutional custody. Simple access.
Explore how this launch could reshape portfolios
Sponsored ContentValuation is complex, but we're here to simplify it.
Discover if T ScientificLtd might be undervalued or overvalued with our detailed analysis, featuring fair value estimates, potential risks, dividends, insider trades, and its financial condition.
Access Free AnalysisHave feedback on this article? Concerned about the content? Get in touch with us directly. Alternatively, email editorial-team (at) simplywallst.com.
This article by Simply Wall St is general in nature. We provide commentary based on historical data and analyst forecasts only using an unbiased methodology and our articles are not intended to be financial advice. It does not constitute a recommendation to buy or sell any stock, and does not take account of your objectives, or your financial situation. We aim to bring you long-term focused analysis driven by fundamental data. Note that our analysis may not factor in the latest price-sensitive company announcements or qualitative material. Simply Wall St has no position in any stocks mentioned.
About KOSDAQ:A057680
T ScientificLtd
Engages in the IT and mobile commerce businesses in South Korea.
Flawless balance sheet and slightly overvalued.
Market Insights

Weekly Picks

THE KINGDOM OF BROWN GOODS: WHY MGPI IS BEING CRUSHED BY INVENTORY & PRIMED FOR RESURRECTION


Why Vertical Aerospace (NYSE: EVTL) is Worth Possibly Over 13x its Current Price


The Quiet Giant That Became AI’s Power Grid
Recently Updated Narratives
Why Vertical Aerospace (NYSE: EVTL) is Worth Possibly Over 13x its Current Price

Deep Value Multi Bagger Opportunity


A case for CA$31.80 (undiluted), aka 8,616% upside from CA$0.37 (an 86 bagger!).
Popular Narratives


MicroVision will explode future revenue by 380.37% with a vision towards success


Crazy Undervalued 42 Baggers Silver Play (Active & Running Mine)


NVDA: Expanding AI Demand Will Drive Major Data Center Investments Through 2026
Trending Discussion


Thanks for sharing these. They really help when I pick what dividend stocks to invest in
