
David Iben put it well when he said, 'Volatility is not a risk we care about. What we care about is avoiding the permanent loss of capital.' So it seems the smart money knows that debt - which is usually involved in bankruptcies - is a very important factor, when you assess how risky a company is. Importantly, T Scientific Co.,Ltd. (KOSDAQ:057680) does carry debt. But the real question is whether this debt is making the company risky.
When Is Debt A Problem?
Generally speaking, debt only becomes a real problem when a company can't easily pay it off, either by raising capital or with its own cash flow. If things get really bad, the lenders can take control of the business. However, a more common (but still painful) scenario is that it has to raise new equity capital at a low price, thus permanently diluting shareholders. Of course, plenty of companies use debt to fund growth, without any negative consequences. The first thing to do when considering how much debt a business uses is to look at its cash and debt together.
View our latest analysis for T ScientificLtd
How Much Debt Does T ScientificLtd Carry?
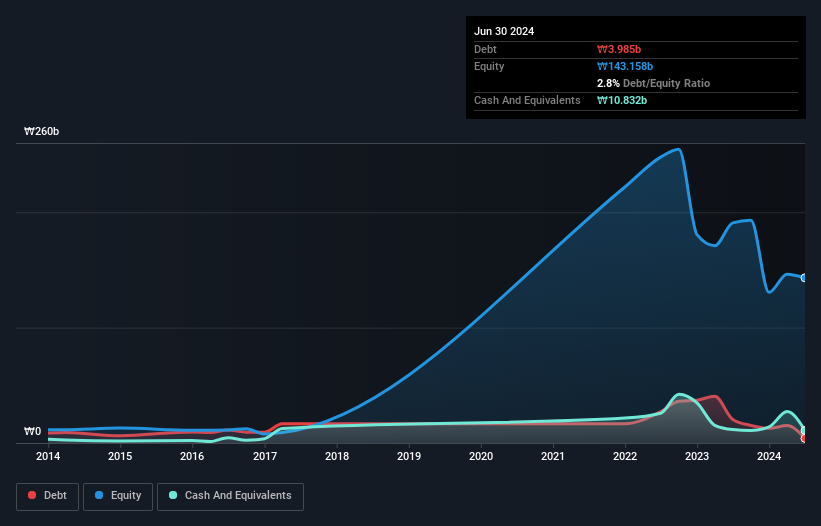
As you can see below, T ScientificLtd had ₩3.99b of debt at June 2024, down from ₩20.4b a year prior. However, its balance sheet shows it holds ₩10.8b in cash, so it actually has ₩6.85b net cash.
How Healthy Is T ScientificLtd's Balance Sheet?
We can see from the most recent balance sheet that T ScientificLtd had liabilities of ₩29.4b falling due within a year, and liabilities of ₩3.28b due beyond that. Offsetting this, it had ₩10.8b in cash and ₩23.0b in receivables that were due within 12 months. So it actually has ₩1.20b more liquid assets than total liabilities.
Having regard to T ScientificLtd's size, it seems that its liquid assets are well balanced with its total liabilities. So it's very unlikely that the ₩80.5b company is short on cash, but still worth keeping an eye on the balance sheet. Succinctly put, T ScientificLtd boasts net cash, so it's fair to say it does not have a heavy debt load! When analysing debt levels, the balance sheet is the obvious place to start. But it is T ScientificLtd's earnings that will influence how the balance sheet holds up in the future. So if you're keen to discover more about its earnings, it might be worth checking out this graph of its long term earnings trend.
In the last year T ScientificLtd wasn't profitable at an EBIT level, but managed to grow its revenue by 152%, to ₩35b. So its pretty obvious shareholders are hoping for more growth!
So How Risky Is T ScientificLtd?
By their very nature companies that are losing money are more risky than those with a long history of profitability. And in the last year T ScientificLtd had an earnings before interest and tax (EBIT) loss, truth be told. And over the same period it saw negative free cash outflow of ₩9.1b and booked a ₩33b accounting loss. But at least it has ₩6.85b on the balance sheet to spend on growth, near-term. Importantly, T ScientificLtd's revenue growth is hot to trot. High growth pre-profit companies may well be risky, but they can also offer great rewards. There's no doubt that we learn most about debt from the balance sheet. However, not all investment risk resides within the balance sheet - far from it. We've identified 4 warning signs with T ScientificLtd (at least 1 which is concerning) , and understanding them should be part of your investment process.
At the end of the day, it's often better to focus on companies that are free from net debt. You can access our special list of such companies (all with a track record of profit growth). It's free.
The New Payments ETF Is Live on NASDAQ:
Money is moving to real-time rails, and a newly listed ETF now gives investors direct exposure. Fast settlement. Institutional custody. Simple access.
Explore how this launch could reshape portfolios
Sponsored ContentValuation is complex, but we're here to simplify it.
Discover if T ScientificLtd might be undervalued or overvalued with our detailed analysis, featuring fair value estimates, potential risks, dividends, insider trades, and its financial condition.
Access Free AnalysisHave feedback on this article? Concerned about the content? Get in touch with us directly. Alternatively, email editorial-team (at) simplywallst.com.
This article by Simply Wall St is general in nature. We provide commentary based on historical data and analyst forecasts only using an unbiased methodology and our articles are not intended to be financial advice. It does not constitute a recommendation to buy or sell any stock, and does not take account of your objectives, or your financial situation. We aim to bring you long-term focused analysis driven by fundamental data. Note that our analysis may not factor in the latest price-sensitive company announcements or qualitative material. Simply Wall St has no position in any stocks mentioned.
About KOSDAQ:A057680
T ScientificLtd
Engages in the IT and mobile commerce businesses in South Korea.
Flawless balance sheet and slightly overvalued.
Market Insights

Weekly Picks

THE KINGDOM OF BROWN GOODS: WHY MGPI IS BEING CRUSHED BY INVENTORY & PRIMED FOR RESURRECTION


Why Vertical Aerospace (NYSE: EVTL) is Worth Possibly Over 13x its Current Price


The Quiet Giant That Became AI’s Power Grid
Recently Updated Narratives


A tech powerhouse quietly powering the world’s AI infrastructure.


Keppel DC REIT (SGX: AJBU) is a resilient gem in the data center space.
Why Vertical Aerospace (NYSE: EVTL) is Worth Possibly Over 13x its Current Price
Popular Narratives

MicroVision will explode future revenue by 380.37% with a vision towards success


Crazy Undervalued 42 Baggers Silver Play (Active & Running Mine)


