
Advertisement
- South Korea
- /
- Semiconductors
- /
- KOSE:A322000
HD Hyundai Energy SolutionsLtd (KRX:322000) Will Be Hoping To Turn Its Returns On Capital Around

Ignoring the stock price of a company, what are the underlying trends that tell us a business is past the growth phase? More often than not, we'll see a declining return on capital employed (ROCE) and a declining amount of capital employed. This combination can tell you that not only is the company investing less, it's earning less on what it does invest. On that note, looking into HD Hyundai Energy SolutionsLtd (KRX:322000), we weren't too upbeat about how things were going.
Our free stock report includes 1 warning sign investors should be aware of before investing in HD Hyundai Energy SolutionsLtd. Read for free now.Understanding Return On Capital Employed (ROCE)
Just to clarify if you're unsure, ROCE is a metric for evaluating how much pre-tax income (in percentage terms) a company earns on the capital invested in its business. The formula for this calculation on HD Hyundai Energy SolutionsLtd is:
Return on Capital Employed = Earnings Before Interest and Tax (EBIT) ÷ (Total Assets - Current Liabilities)
0.0091 = ₩3.5b ÷ (₩454b - ₩70b) (Based on the trailing twelve months to December 2024).
Therefore, HD Hyundai Energy SolutionsLtd has an ROCE of 0.9%. Ultimately, that's a low return and it under-performs the Semiconductor industry average of 5.4%.
View our latest analysis for HD Hyundai Energy SolutionsLtd
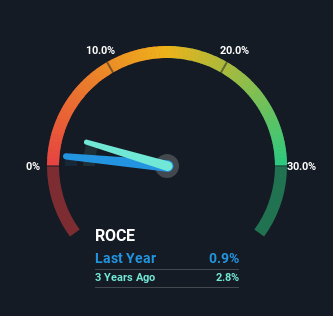
Above you can see how the current ROCE for HD Hyundai Energy SolutionsLtd compares to its prior returns on capital, but there's only so much you can tell from the past. If you'd like, you can check out the forecasts from the analysts covering HD Hyundai Energy SolutionsLtd for free.
What Can We Tell From HD Hyundai Energy SolutionsLtd's ROCE Trend?
There is reason to be cautious about HD Hyundai Energy SolutionsLtd, given the returns are trending downwards. Unfortunately the returns on capital have diminished from the 6.8% that they were earning five years ago. On top of that, it's worth noting that the amount of capital employed within the business has remained relatively steady. Since returns are falling and the business has the same amount of assets employed, this can suggest it's a mature business that hasn't had much growth in the last five years. So because these trends aren't typically conducive to creating a multi-bagger, we wouldn't hold our breath on HD Hyundai Energy SolutionsLtd becoming one if things continue as they have.
On a side note, HD Hyundai Energy SolutionsLtd has done well to pay down its current liabilities to 15% of total assets. So we could link some of this to the decrease in ROCE. What's more, this can reduce some aspects of risk to the business because now the company's suppliers or short-term creditors are funding less of its operations. Since the business is basically funding more of its operations with it's own money, you could argue this has made the business less efficient at generating ROCE.
The Key Takeaway
All in all, the lower returns from the same amount of capital employed aren't exactly signs of a compounding machine. Yet despite these concerning fundamentals, the stock has performed strongly with a 53% return over the last five years, so investors appear very optimistic. In any case, the current underlying trends don't bode well for long term performance so unless they reverse, we'd start looking elsewhere.
HD Hyundai Energy SolutionsLtd does have some risks though, and we've spotted 1 warning sign for HD Hyundai Energy SolutionsLtd that you might be interested in.
While HD Hyundai Energy SolutionsLtd may not currently earn the highest returns, we've compiled a list of companies that currently earn more than 25% return on equity. Check out this free list here.
Valuation is complex, but we're here to simplify it.
Discover if HD Hyundai Energy SolutionsLtd might be undervalued or overvalued with our detailed analysis, featuring fair value estimates, potential risks, dividends, insider trades, and its financial condition.
Access Free AnalysisHave feedback on this article? Concerned about the content? Get in touch with us directly. Alternatively, email editorial-team (at) simplywallst.com.
This article by Simply Wall St is general in nature. We provide commentary based on historical data and analyst forecasts only using an unbiased methodology and our articles are not intended to be financial advice. It does not constitute a recommendation to buy or sell any stock, and does not take account of your objectives, or your financial situation. We aim to bring you long-term focused analysis driven by fundamental data. Note that our analysis may not factor in the latest price-sensitive company announcements or qualitative material. Simply Wall St has no position in any stocks mentioned.
About KOSE:A322000
Flawless balance sheet with high growth potential.
Market Insights

Advertisement
Community Narratives
Pole position to benefit from GENIUS Act
Fair Value US$233.04|59.7% undervalued
CH
Community Contributor
IREN will transform from bitcoin miner to leader in AI infrastructure
Fair Value US$21.48|13.5% undervalued
KA
Community Contributor
Behind the Assay: XRF Scientific’s Role in Modern Mining Economics
Fair Value AU$2.10|2.9% undervalued
RO
Community Contributor