
Advertisement
- South Korea
- /
- Semiconductors
- /
- KOSDAQ:A200470
APACT Co., Ltd.'s (KOSDAQ:200470) 32% Dip Still Leaving Some Shareholders Feeling Restless Over Its P/SRatio
To the annoyance of some shareholders, APACT Co., Ltd. (KOSDAQ:200470) shares are down a considerable 32% in the last month, which continues a horrid run for the company. The recent drop has obliterated the annual return, with the share price now down 5.7% over that longer period.
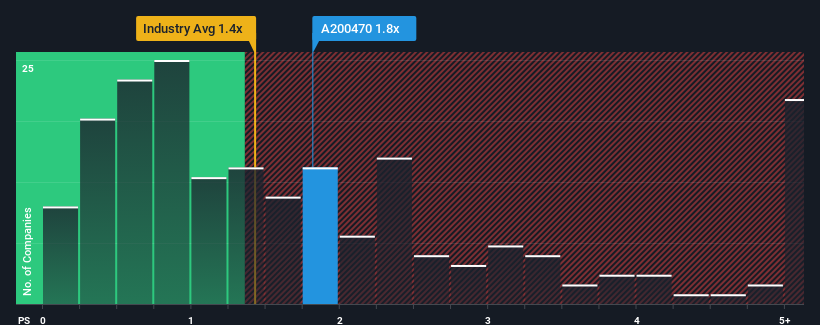
Even after such a large drop in price, there still wouldn't be many who think APACT's price-to-sales (or "P/S") ratio of 1.8x is worth a mention when the median P/S in Korea's Semiconductor industry is similar at about 1.4x. However, investors might be overlooking a clear opportunity or potential setback if there is no rational basis for the P/S.
Check out our latest analysis for APACT
How APACT Has Been Performing
As an illustration, revenue has deteriorated at APACT over the last year, which is not ideal at all. Perhaps investors believe the recent revenue performance is enough to keep in line with the industry, which is keeping the P/S from dropping off. If not, then existing shareholders may be a little nervous about the viability of the share price.
Want the full picture on earnings, revenue and cash flow for the company? Then our free report on APACT will help you shine a light on its historical performance.Is There Some Revenue Growth Forecasted For APACT?
In order to justify its P/S ratio, APACT would need to produce growth that's similar to the industry.
Retrospectively, the last year delivered a frustrating 26% decrease to the company's top line. Still, the latest three year period has seen an excellent 69% overall rise in revenue, in spite of its unsatisfying short-term performance. So we can start by confirming that the company has generally done a very good job of growing revenue over that time, even though it had some hiccups along the way.
Comparing that to the industry, which is predicted to deliver 70% growth in the next 12 months, the company's momentum is weaker, based on recent medium-term annualised revenue results.
In light of this, it's curious that APACT's P/S sits in line with the majority of other companies. Apparently many investors in the company are less bearish than recent times would indicate and aren't willing to let go of their stock right now. Maintaining these prices will be difficult to achieve as a continuation of recent revenue trends is likely to weigh down the shares eventually.
The Bottom Line On APACT's P/S
Following APACT's share price tumble, its P/S is just clinging on to the industry median P/S. Generally, our preference is to limit the use of the price-to-sales ratio to establishing what the market thinks about the overall health of a company.
Our examination of APACT revealed its poor three-year revenue trends aren't resulting in a lower P/S as per our expectations, given they look worse than current industry outlook. When we see weak revenue with slower than industry growth, we suspect the share price is at risk of declining, bringing the P/S back in line with expectations. If recent medium-term revenue trends continue, the probability of a share price decline will become quite substantial, placing shareholders at risk.
We don't want to rain on the parade too much, but we did also find 3 warning signs for APACT that you need to be mindful of.
If companies with solid past earnings growth is up your alley, you may wish to see this free collection of other companies with strong earnings growth and low P/E ratios.
New: Manage All Your Stock Portfolios in One Place
We've created the ultimate portfolio companion for stock investors, and it's free.
• Connect an unlimited number of Portfolios and see your total in one currency
• Be alerted to new Warning Signs or Risks via email or mobile
• Track the Fair Value of your stocks
Have feedback on this article? Concerned about the content? Get in touch with us directly. Alternatively, email editorial-team (at) simplywallst.com.
This article by Simply Wall St is general in nature. We provide commentary based on historical data and analyst forecasts only using an unbiased methodology and our articles are not intended to be financial advice. It does not constitute a recommendation to buy or sell any stock, and does not take account of your objectives, or your financial situation. We aim to bring you long-term focused analysis driven by fundamental data. Note that our analysis may not factor in the latest price-sensitive company announcements or qualitative material. Simply Wall St has no position in any stocks mentioned.
About KOSDAQ:A200470
APACT
Manufactures and sells semiconductor testing equipment in South Korea.
Mediocre balance sheet with very low risk.
Market Insights

Advertisement
Community Narratives
MicroVision will explode future revenue by 380.37% with a vision towards success
Fair Value US$60|98.4% undervalued
TH
Community Contributor
The Indispensable Artery for a New North American Economy
Fair Value CA$132.87|0.7% overvalued
TI
Community Contributor
Recently Updated Narratives
CO

composite32 on Astor Enerji ·
Astor Enerji will surge with a fair value of $140.43 in the next 3 years
Fair Value:₺140.4335.5% undervalued
1 followerusers have followed this narrative
0 commentsusers have commented on this narrative
0 likesusers have liked this narrative
RE

RecMag on Proximus ·
Proximus: The State-Backed Backup Plan with 7% Gross Yield and 15% Currency Upside.
Fair Value:€17.1356.7% undervalued
30 followersusers have followed this narrative
0 commentsusers have commented on this narrative
0 likesusers have liked this narrative
AG


Agricola on IMPACT Silver ·
A case for for IMPACT Silver Corp (TSXV:IPT) to reach USD $4.52 (CAD $6.16) in 2026 (23 bagger in 1 year) and USD $5.76 (CAD $7.89) by 2030
Fair Value:CA$7.8996.2% undervalued
1 followerusers have followed this narrative
0 commentsusers have commented on this narrative
0 likesusers have liked this narrative
Popular Narratives
TH

TheWallstreetKing on MicroVision ·
MicroVision will explode future revenue by 380.37% with a vision towards success
Fair Value:US$6098.4% undervalued
101 followersusers have followed this narrative
10 commentsusers have commented on this narrative
20 likesusers have liked this narrative
OS


oscargarcia on Alphabet ·
The company that turned a verb into a global necessity and basically runs the modern internet, digital ads, smartphones, maps, and AI.
Fair Value:US$3405.8% undervalued
139 followersusers have followed this narrative
6 commentsusers have commented on this narrative
18 likesusers have liked this narrative
AN


AnalystConsensusTarget on NVIDIA ·
NVDA: Expanding AI Demand Will Drive Major Data Center Investments Through 2026
Fair Value:US$250.3929.3% undervalued
931 followersusers have followed this narrative
6 commentsusers have commented on this narrative
23 likesusers have liked this narrative