
Advertisement
- South Korea
- /
- Semiconductors
- /
- KOSDAQ:A031980
PSK HOLDINGS Inc.'s (KOSDAQ:031980) Stock Is Going Strong: Is the Market Following Fundamentals?
PSK HOLDINGS (KOSDAQ:031980) has had a great run on the share market with its stock up by a significant 47% over the last three months. Since the market usually pay for a company’s long-term fundamentals, we decided to study the company’s key performance indicators to see if they could be influencing the market. In this article, we decided to focus on PSK HOLDINGS' ROE.
Return on equity or ROE is a key measure used to assess how efficiently a company's management is utilizing the company's capital. Put another way, it reveals the company's success at turning shareholder investments into profits.
How Do You Calculate Return On Equity?
ROE can be calculated by using the formula:
Return on Equity = Net Profit (from continuing operations) ÷ Shareholders' Equity
So, based on the above formula, the ROE for PSK HOLDINGS is:
21% = ₩95b ÷ ₩441b (Based on the trailing twelve months to June 2025).
The 'return' is the profit over the last twelve months. Another way to think of that is that for every ₩1 worth of equity, the company was able to earn ₩0.21 in profit.
Check out our latest analysis for PSK HOLDINGS
What Is The Relationship Between ROE And Earnings Growth?
Thus far, we have learned that ROE measures how efficiently a company is generating its profits. Depending on how much of these profits the company reinvests or "retains", and how effectively it does so, we are then able to assess a company’s earnings growth potential. Assuming all else is equal, companies that have both a higher return on equity and higher profit retention are usually the ones that have a higher growth rate when compared to companies that don't have the same features.
PSK HOLDINGS' Earnings Growth And 21% ROE
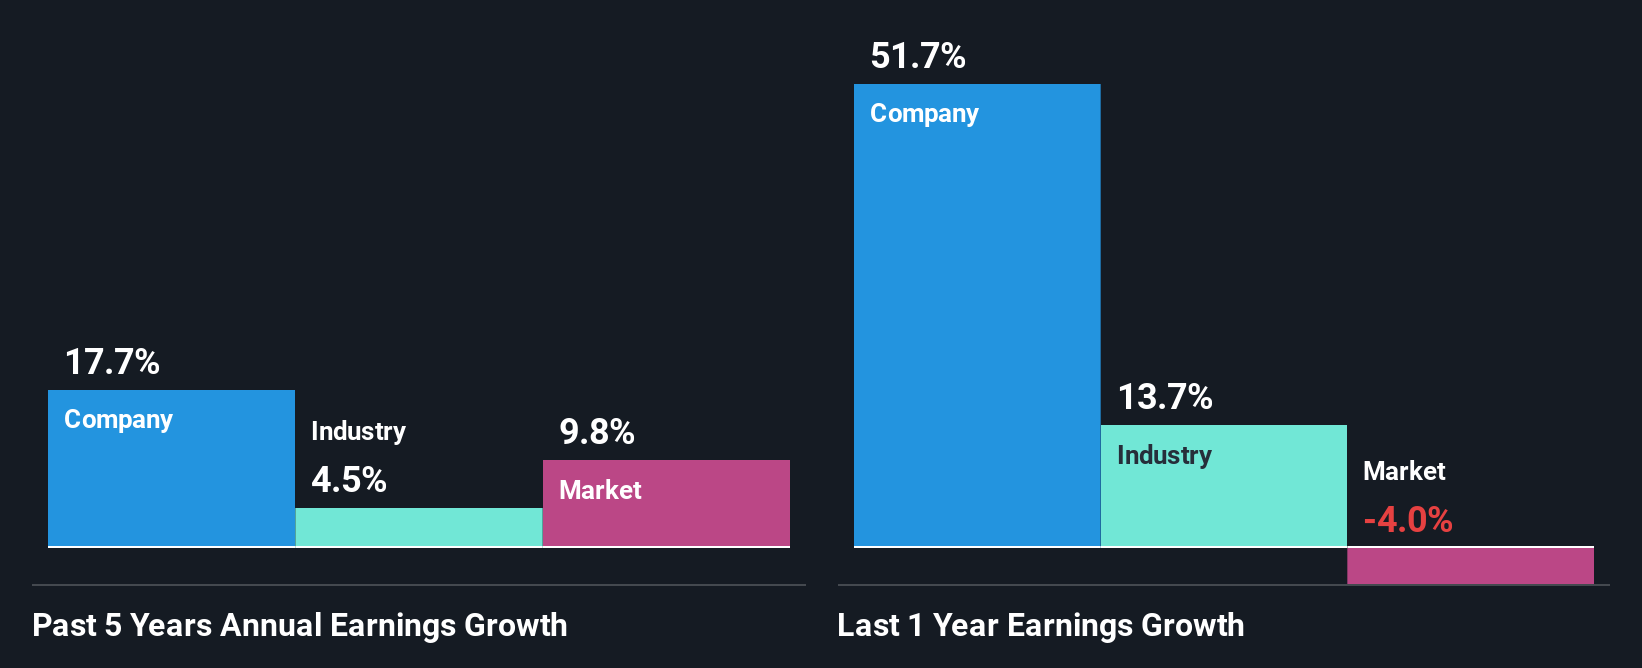
To start with, PSK HOLDINGS' ROE looks acceptable. On comparing with the average industry ROE of 7.4% the company's ROE looks pretty remarkable. This certainly adds some context to PSK HOLDINGS' decent 18% net income growth seen over the past five years.
We then compared PSK HOLDINGS' net income growth with the industry and we're pleased to see that the company's growth figure is higher when compared with the industry which has a growth rate of 4.5% in the same 5-year period.
Earnings growth is an important metric to consider when valuing a stock. What investors need to determine next is if the expected earnings growth, or the lack of it, is already built into the share price. This then helps them determine if the stock is placed for a bright or bleak future. If you're wondering about PSK HOLDINGS''s valuation, check out this gauge of its price-to-earnings ratio, as compared to its industry.
Is PSK HOLDINGS Using Its Retained Earnings Effectively?
PSK HOLDINGS has a low three-year median payout ratio of 23%, meaning that the company retains the remaining 77% of its profits. This suggests that the management is reinvesting most of the profits to grow the business.
Moreover, PSK HOLDINGS is determined to keep sharing its profits with shareholders which we infer from its long history of six years of paying a dividend. Our latest analyst data shows that the future payout ratio of the company is expected to drop to 0.3% over the next three years. Regardless, the future ROE for PSK HOLDINGS is predicted to decline to 16% despite the anticipated decrease in the payout ratio. We reckon that there could probably be other factors that could be driving the forseen decline in the company's ROE.
Summary
Overall, we are quite pleased with PSK HOLDINGS' performance. In particular, it's great to see that the company is investing heavily into its business and along with a high rate of return, that has resulted in a sizeable growth in its earnings. With that said, on studying the latest analyst forecasts, we found that while the company has seen growth in its past earnings, analysts expect its future earnings to shrink. To know more about the latest analysts predictions for the company, check out this visualization of analyst forecasts for the company.
New: Manage All Your Stock Portfolios in One Place
We've created the ultimate portfolio companion for stock investors, and it's free.
• Connect an unlimited number of Portfolios and see your total in one currency
• Be alerted to new Warning Signs or Risks via email or mobile
• Track the Fair Value of your stocks
Have feedback on this article? Concerned about the content? Get in touch with us directly. Alternatively, email editorial-team (at) simplywallst.com.
This article by Simply Wall St is general in nature. We provide commentary based on historical data and analyst forecasts only using an unbiased methodology and our articles are not intended to be financial advice. It does not constitute a recommendation to buy or sell any stock, and does not take account of your objectives, or your financial situation. We aim to bring you long-term focused analysis driven by fundamental data. Note that our analysis may not factor in the latest price-sensitive company announcements or qualitative material. Simply Wall St has no position in any stocks mentioned.
About KOSDAQ:A031980
PSK HOLDINGS
Manufactures and sells semiconductor manufacturing and flat panel display equipment worldwide.
Flawless balance sheet with proven track record.
Market Insights

Advertisement
Community Narratives
A formidable player in AI and enterprise computing.
Fair Value US$210.00|12.2% overvalued
CO
Community Contributor
IREN's Bold Moves in Sustainable Bitcoin Mining & AI Data Centers
Fair Value US$72.52|17.1% undervalued
BL
Community Contributor
Cooling the Champions: The Aussie Tech Behind F1's Victories
Fair Value AU$12.40|38.7% undervalued
TR
Community Contributor