
Advertisement
- South Korea
- /
- Pharma
- /
- KOSE:A185750
A Look At The Fair Value Of Chong Kun Dang Pharmaceutical Corp. (KRX:185750)

Key Insights
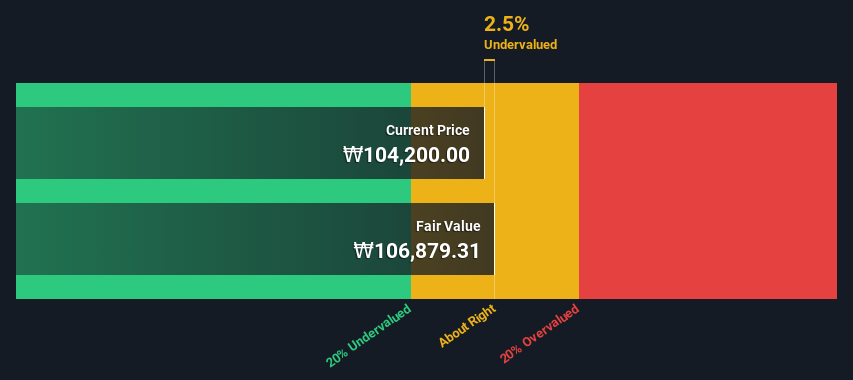
- Using the 2 Stage Free Cash Flow to Equity, Chong Kun Dang Pharmaceutical fair value estimate is ₩106,879
- Chong Kun Dang Pharmaceutical's ₩104,200 share price indicates it is trading at similar levels as its fair value estimate
- Analyst price target for A185750 is ₩152,333, which is 43% above our fair value estimate
In this article we are going to estimate the intrinsic value of Chong Kun Dang Pharmaceutical Corp. (KRX:185750) by taking the expected future cash flows and discounting them to today's value. We will use the Discounted Cash Flow (DCF) model on this occasion. Before you think you won't be able to understand it, just read on! It's actually much less complex than you'd imagine.
Companies can be valued in a lot of ways, so we would point out that a DCF is not perfect for every situation. If you want to learn more about discounted cash flow, the rationale behind this calculation can be read in detail in the Simply Wall St analysis model.
See our latest analysis for Chong Kun Dang Pharmaceutical
Is Chong Kun Dang Pharmaceutical Fairly Valued?
We're using the 2-stage growth model, which simply means we take in account two stages of company's growth. In the initial period the company may have a higher growth rate and the second stage is usually assumed to have a stable growth rate. To start off with, we need to estimate the next ten years of cash flows. Where possible we use analyst estimates, but when these aren't available we extrapolate the previous free cash flow (FCF) from the last estimate or reported value. We assume companies with shrinking free cash flow will slow their rate of shrinkage, and that companies with growing free cash flow will see their growth rate slow, over this period. We do this to reflect that growth tends to slow more in the early years than it does in later years.
A DCF is all about the idea that a dollar in the future is less valuable than a dollar today, and so the sum of these future cash flows is then discounted to today's value:
10-year free cash flow (FCF) estimate
| 2024 | 2025 | 2026 | 2027 | 2028 | 2029 | 2030 | 2031 | 2032 | 2033 | |
| Levered FCF (₩, Millions) | ₩83.2b | ₩92.2b | ₩112.0b | ₩88.7b | ₩76.4b | ₩69.5b | ₩65.7b | ₩63.6b | ₩62.6b | ₩62.4b |
| Growth Rate Estimate Source | Analyst x6 | Analyst x7 | Analyst x1 | Est @ -20.83% | Est @ -13.86% | Est @ -8.98% | Est @ -5.56% | Est @ -3.17% | Est @ -1.50% | Est @ -0.32% |
| Present Value (₩, Millions) Discounted @ 6.7% | ₩78.0k | ₩81.0k | ₩92.3k | ₩68.5k | ₩55.3k | ₩47.2k | ₩41.8k | ₩37.9k | ₩35.0k | ₩32.7k |
("Est" = FCF growth rate estimated by Simply Wall St)
Present Value of 10-year Cash Flow (PVCF) = ₩570b
After calculating the present value of future cash flows in the initial 10-year period, we need to calculate the Terminal Value, which accounts for all future cash flows beyond the first stage. The Gordon Growth formula is used to calculate Terminal Value at a future annual growth rate equal to the 5-year average of the 10-year government bond yield of 2.4%. We discount the terminal cash flows to today's value at a cost of equity of 6.7%.
Terminal Value (TV)= FCF2033 × (1 + g) ÷ (r – g) = ₩62b× (1 + 2.4%) ÷ (6.7%– 2.4%) = ₩1.5t
Present Value of Terminal Value (PVTV)= TV / (1 + r)10= ₩1.5t÷ ( 1 + 6.7%)10= ₩788b
The total value, or equity value, is then the sum of the present value of the future cash flows, which in this case is ₩1.4t. The last step is to then divide the equity value by the number of shares outstanding. Compared to the current share price of ₩104k, the company appears about fair value at a 2.5% discount to where the stock price trades currently. Remember though, that this is just an approximate valuation, and like any complex formula - garbage in, garbage out.
The Assumptions
Now the most important inputs to a discounted cash flow are the discount rate, and of course, the actual cash flows. If you don't agree with these result, have a go at the calculation yourself and play with the assumptions. The DCF also does not consider the possible cyclicality of an industry, or a company's future capital requirements, so it does not give a full picture of a company's potential performance. Given that we are looking at Chong Kun Dang Pharmaceutical as potential shareholders, the cost of equity is used as the discount rate, rather than the cost of capital (or weighted average cost of capital, WACC) which accounts for debt. In this calculation we've used 6.7%, which is based on a levered beta of 0.800. Beta is a measure of a stock's volatility, compared to the market as a whole. We get our beta from the industry average beta of globally comparable companies, with an imposed limit between 0.8 and 2.0, which is a reasonable range for a stable business.
SWOT Analysis for Chong Kun Dang Pharmaceutical
Strength
- Earnings growth over the past year exceeded the industry.
- Debt is not viewed as a risk.
- Dividends are covered by earnings and cash flows.
Weakness
- Dividend is low compared to the top 25% of dividend payers in the Pharmaceuticals market.
Opportunity
- Good value based on P/E ratio and estimated fair value.
Threat
- Annual earnings are forecast to decline for the next 2 years.
Looking Ahead:
Although the valuation of a company is important, it ideally won't be the sole piece of analysis you scrutinize for a company. DCF models are not the be-all and end-all of investment valuation. Preferably you'd apply different cases and assumptions and see how they would impact the company's valuation. For instance, if the terminal value growth rate is adjusted slightly, it can dramatically alter the overall result. For Chong Kun Dang Pharmaceutical, there are three additional elements you should further research:
- Risks: For example, we've discovered 2 warning signs for Chong Kun Dang Pharmaceutical (1 is a bit unpleasant!) that you should be aware of before investing here.
- Future Earnings: How does A185750's growth rate compare to its peers and the wider market? Dig deeper into the analyst consensus number for the upcoming years by interacting with our free analyst growth expectation chart.
- Other High Quality Alternatives: Do you like a good all-rounder? Explore our interactive list of high quality stocks to get an idea of what else is out there you may be missing!
PS. The Simply Wall St app conducts a discounted cash flow valuation for every stock on the KOSE every day. If you want to find the calculation for other stocks just search here.
New: AI Stock Screener & Alerts
Our new AI Stock Screener scans the market every day to uncover opportunities.
• Dividend Powerhouses (3%+ Yield)
• Undervalued Small Caps with Insider Buying
• High growth Tech and AI Companies
Or build your own from over 50 metrics.
Have feedback on this article? Concerned about the content? Get in touch with us directly. Alternatively, email editorial-team (at) simplywallst.com.
This article by Simply Wall St is general in nature. We provide commentary based on historical data and analyst forecasts only using an unbiased methodology and our articles are not intended to be financial advice. It does not constitute a recommendation to buy or sell any stock, and does not take account of your objectives, or your financial situation. We aim to bring you long-term focused analysis driven by fundamental data. Note that our analysis may not factor in the latest price-sensitive company announcements or qualitative material. Simply Wall St has no position in any stocks mentioned.
About KOSE:A185750
Chong Kun Dang Pharmaceutical
Engages in the manufacturing, marketing, and sales of medicines in South Korea and internationally.
Flawless balance sheet and good value.
Market Insights

Advertisement
Community Narratives
The Most Undervalued of the Magnificent 7
Fair Value US$237.43|36.3% undervalued
IN
Community Contributor
PVA TePla's New Strategy Aims for 22% Revenue Growth in Semiconductor Recovery
Fair Value €19.19|20.8% undervalued
MI
Community Contributor